CBL & Associates Properties (CBL): Valuation Check After New Buyback Plan and $158 Million Refinancing Move
CBL & Associates Properties, Inc. CBL | 40.99 40.99 | -0.05% 0.00% Post |
CBL & Associates Properties (CBL) just paired a fresh 25 million stock repurchase program with nearly 158 million in new financing, including cheaper debt used to retire existing loans, sharpening its balance sheet.
That backdrop helps explain why, even after a 1 day share price pullback of 2.91 percent to 37.09 dollars, CBL’s 30 day share price return of 12.19 percent and 1 year total shareholder return of 36.8 percent point to strengthening momentum.
If this mix of balance sheet cleanup and improving sentiment has your attention, it could be a good moment to explore fast growing stocks with high insider ownership for more ideas riding similar tailwinds.
With the stock still trading at a hefty discount to analyst targets and management signaling confidence through buybacks and refinancing, the key question now is whether CBL remains undervalued or if the market is already pricing in its next leg of growth.
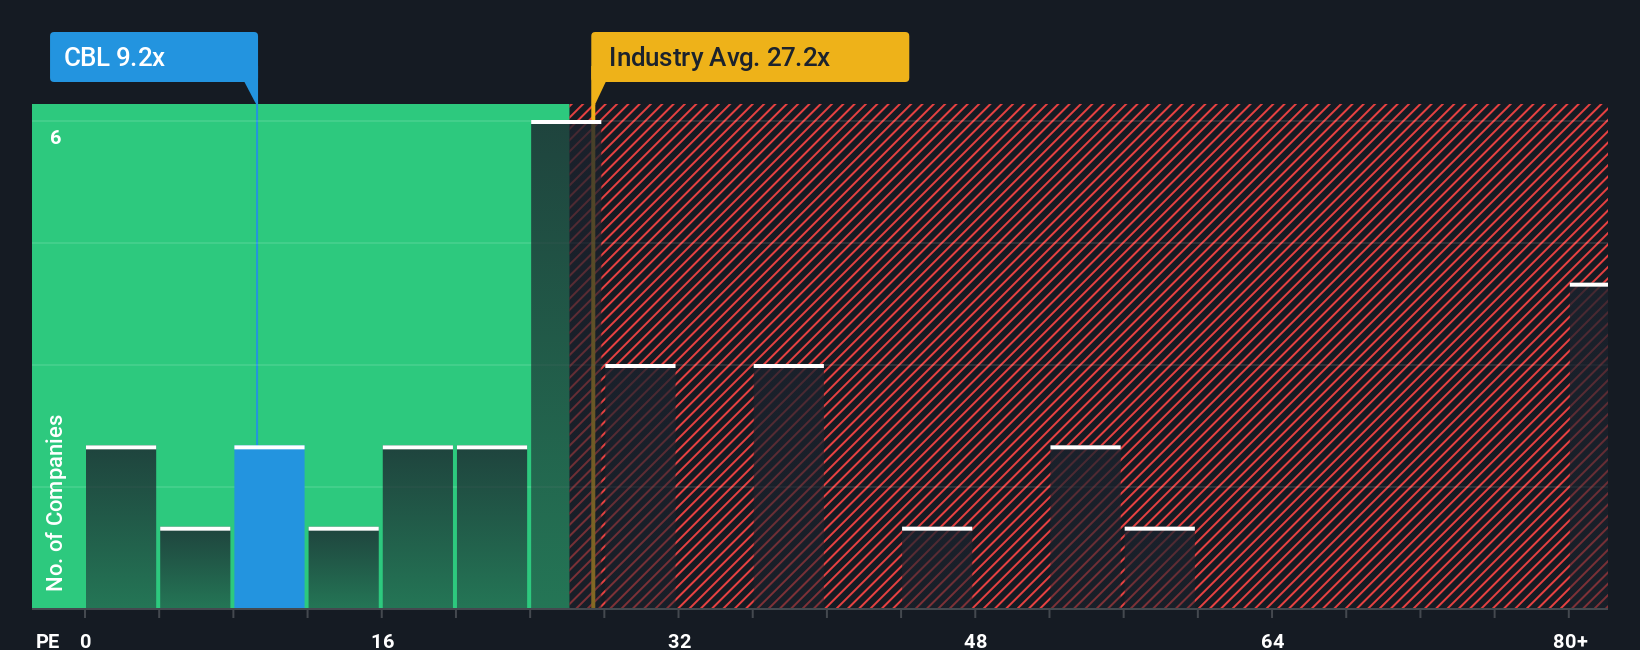
Price-to-Earnings of 9.2x: Is it justified?
At a last close of 37.09 dollars, CBL trades on a 9.2 times price to earnings ratio, pointing to a notable discount versus peers.
The price to earnings multiple compares what investors pay today to each dollar of current earnings, which is especially important for profitable retail REITs like CBL.
Here, a 9.2 times multiple looks restrained given the company has just delivered a sharp rebound into profitability and sits 38.7 percent below one estimate of fair value based on our DCF model.
Against that backdrop, the contrast is stark. CBL’s 9.2 times price to earnings ratio sits well below the US Retail REITs industry average of 27.2 times, the peer average of 69.9 times and even the estimated fair price to earnings ratio of 18.6 times, a level the market could migrate toward if sentiment and fundamentals stay aligned.
Result: Price-to-Earnings of 9.2x (UNDERVALUED)
However, CBL still faces pressure from structurally challenged mall traffic, and any renewed weakness in tenant demand could quickly compress earnings and slow multiple expansion.
Another View: What If The Market Is Already Catching On?
While the 9.2 times price to earnings ratio suggests CBL is cheap versus peers and its own fair ratio, the stock has already climbed nearly 37 percent over the past year, closing some of that gap and narrowing the margin of safety if earnings stumble.
Simply Wall St performs a discounted cash flow (DCF) on every stock in the world every day (check out CBL & Associates Properties for example). We show the entire calculation in full. You can track the result in your watchlist or portfolio and be alerted when this changes, or use our stock screener to discover 910 undervalued stocks based on their cash flows. If you save a screener we even alert you when new companies match - so you never miss a potential opportunity.
Build Your Own CBL & Associates Properties Narrative
If you see the story differently or want to dig into the numbers yourself, you can build a personalized view in just a few minutes: Do it your way.
A great starting point for your CBL & Associates Properties research is our analysis highlighting 3 key rewards and 4 important warning signs that could impact your investment decision.
Ready for more high potential opportunities?
Before you move on, lock in your next ideas now with a focused set of opportunities that could reshape your portfolio faster than the headline names.
- Target reliable cash flow streams by reviewing these 12 dividend stocks with yields > 3% that can keep paying you even when markets turn choppy.
- Position yourself for the next wave of innovation by scanning these 24 AI penny stocks shaping how businesses, consumers and entire industries use intelligent technology.
- Lean into value and momentum together by assessing these 910 undervalued stocks based on cash flows that the market has not fully priced, before attention catches up.
This article by Simply Wall St is general in nature. We provide commentary based on historical data and analyst forecasts only using an unbiased methodology and our articles are not intended to be financial advice. It does not constitute a recommendation to buy or sell any stock, and does not take account of your objectives, or your financial situation. We aim to bring you long-term focused analysis driven by fundamental data. Note that our analysis may not factor in the latest price-sensitive company announcements or qualitative material. Simply Wall St has no position in any stocks mentioned.