Central Pacific Financial (CPF) Net Interest Margin Resilience Tests Cautious Earnings Narratives
Central Pacific Financial Corp. CPF | 32.63 | -0.12% |
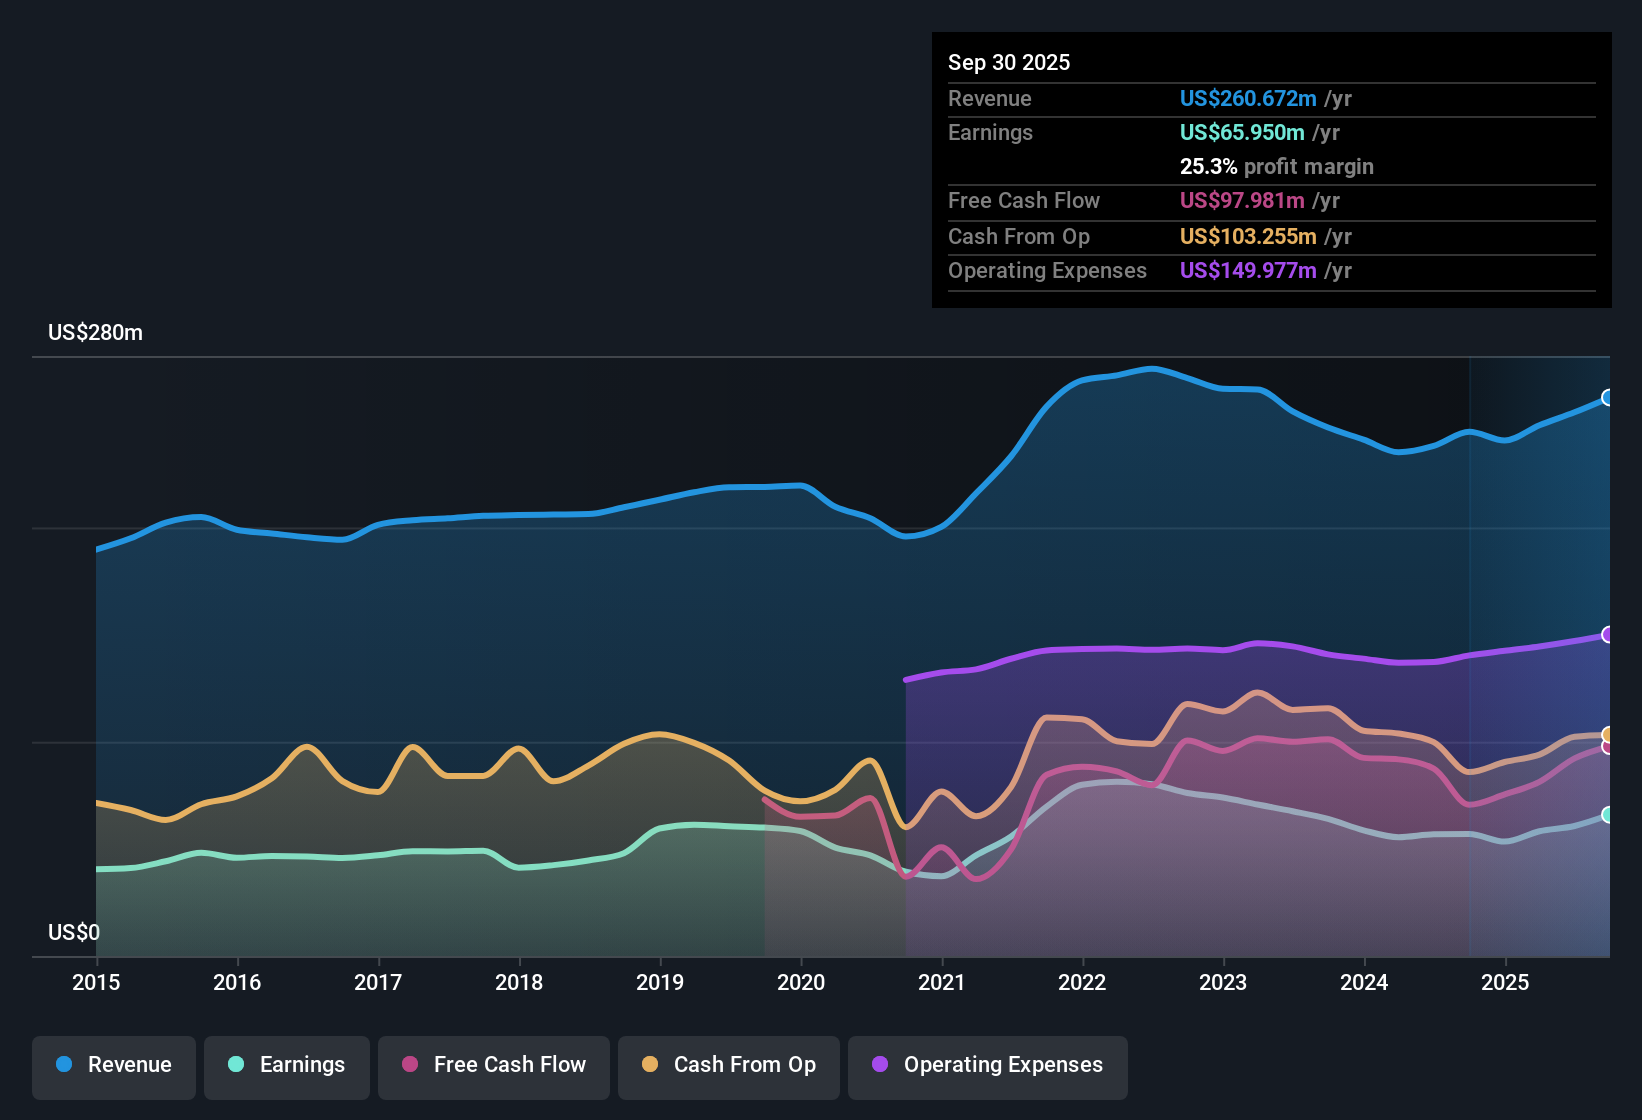
Central Pacific Financial (CPF) capped FY 2025 with fourth quarter total revenue of US$73.9 million and basic EPS of US$0.86, while trailing twelve month revenue came in at US$277.0 million and EPS at US$2.88. Over the last few quarters, the company has seen revenue move from US$57.6 million in Q4 FY 2024 to US$73.9 million in Q4 FY 2025, with quarterly EPS shifting from US$0.42 to US$0.86 over the same period. With trailing net margin now at 28.0% and profit growth flagged as strong in the supplied data, the latest results place earnings quality and profitability firmly in focus for investors.
See our full analysis for Central Pacific Financial.With the headline numbers on the table, the next step is to see how this earnings profile lines up with widely held views about Central Pacific Financial, highlighting where the data supports the prevailing stories and where it pushes back against them.
Net interest margin holds at 3.56% in Q4
- Central Pacific Financial reported a Q4 FY 2025 net interest margin of 3.56%, compared with 3.49% in Q3 FY 2025 and 3.31% in Q1 FY 2025, while the trailing twelve month margin stood at 3.45% versus 3.01% a year earlier.
- What is interesting for a bullish view is that this margin profile sits alongside trailing net profit growth of 45.1% and net income of US$77.5 million over the last twelve months, which
- aligns with the idea that earnings quality has improved as the trailing net margin moved from 22.2% to 28.0% over the year
- shows that the recent margin level is being earned on a loan book of about US$5.3b, with total loans at US$5,289.1 million in Q4 FY 2025.
Cost to income ratio steady around 60%
- The cost to income ratio sat at 59.88% in Q4 FY 2025, close to the trailing twelve month figure of 60.54%, compared with 61.16% in Q1 FY 2025 and 65.1% on the trailing basis a year earlier.
- Bears might focus on this roughly 60% expense load as a cap on further profitability, yet the numbers show that
- net income for FY 2025 quarters ranged from US$17.8 million to US$22.9 million, with Q4 at US$22.9 million, even while that cost base persisted
- EPS over the last twelve months reached US$2.88, up from US$1.97 a year earlier on a trailing basis, which challenges the idea that the current efficiency level is holding back earnings power.
Valuation, DCF fair value and growth gap
- At a share price of US$32.57, Central Pacific Financial trades on a trailing P/E of 11.3x versus the US Banks industry at 11.8x and peers at 12.3x, while the supplied DCF fair value of US$58.31 is materially higher than the current price and the only analyst price target provided is US$35.50.
- What stands out for a bullish lens is that this lower P/E and wide gap to the DCF fair value sit next to forecast earnings growth of about 6.45% a year and revenue growth of about 7.3% a year, which
- are below the broader US market figures cited, yet come after trailing net income growth of 45.1% and a move in net margin from 22.2% to 28.0%
- create a tension where the data signals value and a 3.56% dividend yield today, while the slower forecast growth profile may make some investors question how far the valuation could close the gap to US$58.31.
Next Steps
Don't just look at this quarter; the real story is in the long-term trend. We've done an in-depth analysis on Central Pacific Financial's growth and its valuation to see if today's price is a bargain. Add the company to your watchlist or portfolio now so you don't miss the next big move.
See What Else Is Out There
Central Pacific Financial’s roughly 60% cost to income ratio, modest forecast earnings growth and below market growth expectations may limit how quickly its valuation gap closes.
If that mix of slower growth and cost pressure feels limiting, check out our stable growth stocks screener (2168 results) to focus on companies built around steadier revenue and earnings momentum.
This article by Simply Wall St is general in nature. We provide commentary based on historical data and analyst forecasts only using an unbiased methodology and our articles are not intended to be financial advice. It does not constitute a recommendation to buy or sell any stock, and does not take account of your objectives, or your financial situation. We aim to bring you long-term focused analysis driven by fundamental data. Note that our analysis may not factor in the latest price-sensitive company announcements or qualitative material. Simply Wall St has no position in any stocks mentioned.