Cimpress (CMPR) Q2 Profit Return Tests Bullish High‑Growth Narratives
Cimpress Plc CMPR | 73.87 73.87 | -0.38% 0.00% Pre |
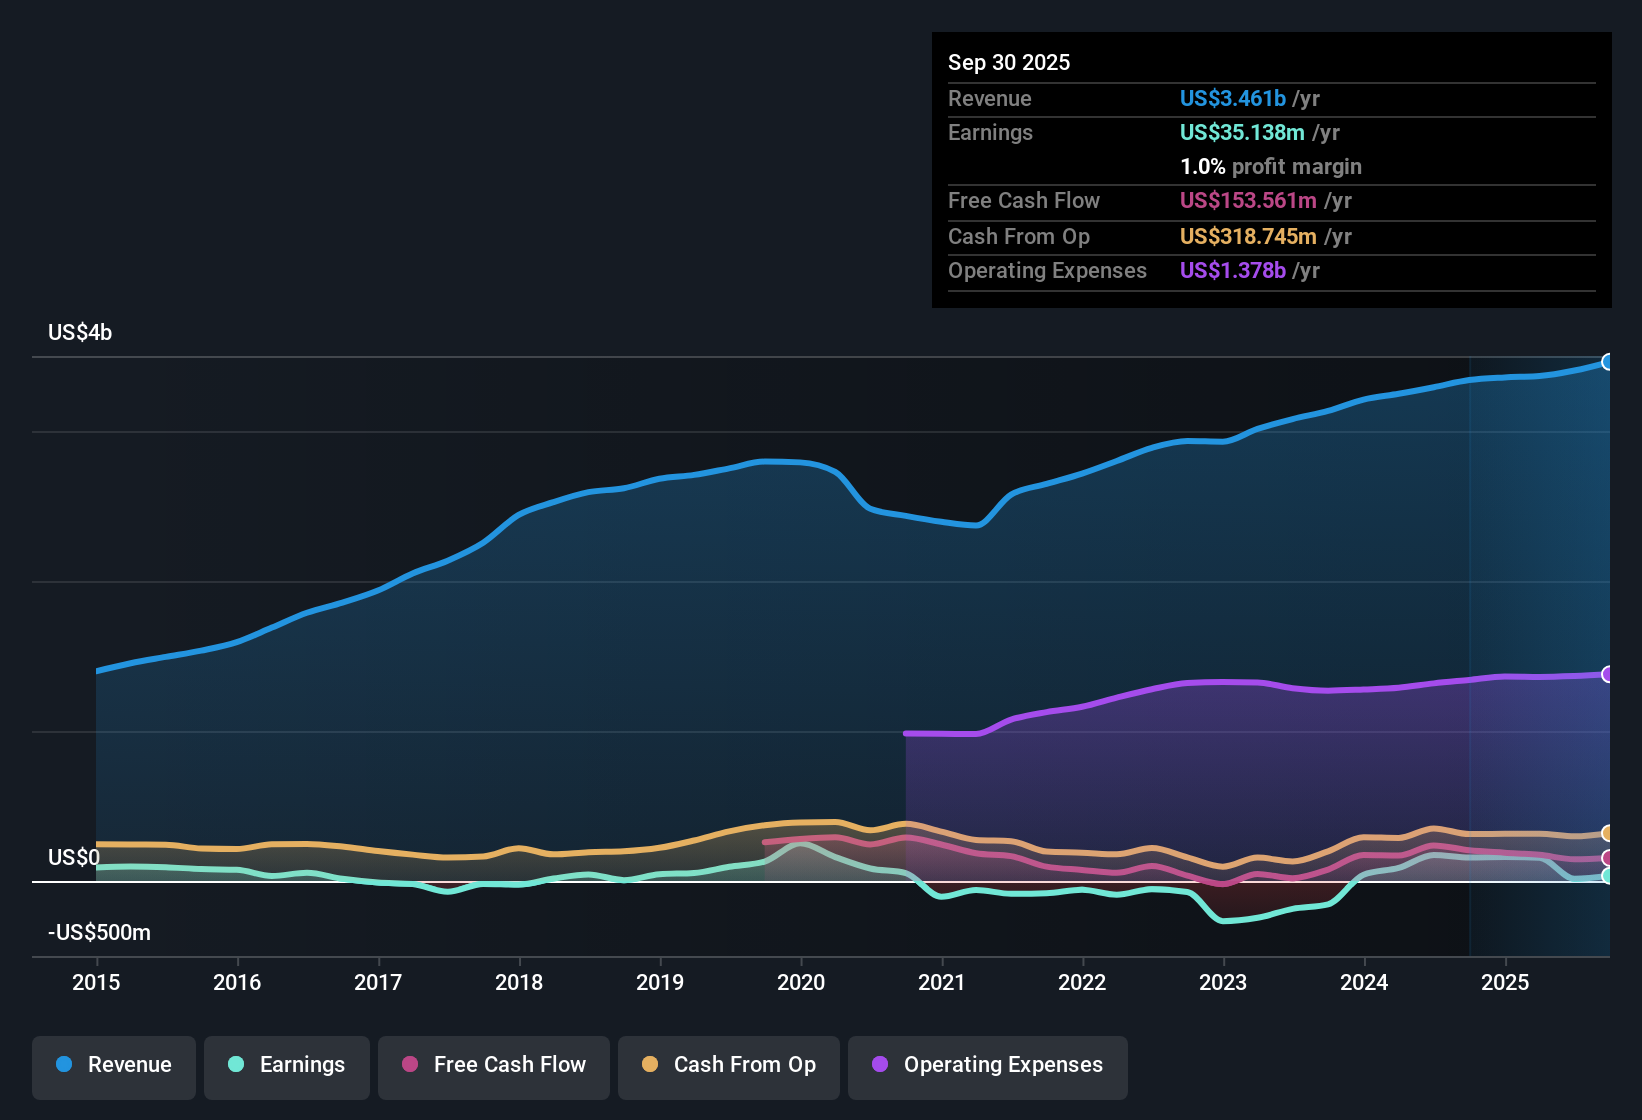
Cimpress (CMPR) has put up a busy Q2 2026, with revenue at US$1.0 billion and basic EPS of US$2.01, alongside net income of US$49.3 million. The trailing twelve months show revenue of US$3.6 billion and EPS of US$0.95 tied to net income of US$23.4 million. The company has seen quarterly revenue move from US$939.2 million in Q2 2025 to US$1.0 billion in Q2 2026, while basic EPS has shifted from US$2.45 to US$2.01 over the same period. This sets up a picture where top line scale is being tested against relatively thin profitability. With trailing net margins low and interest coverage flagged as weak, this set of results puts the focus squarely on how much of Cimpress's growth story can translate into sturdier margins.
See our full analysis for Cimpress.With the latest figures on the table, the next step is to see how Cimpress's reported growth, margins and earnings profile line up against the widely held narratives around its business and financial risk.
Q2 swings to US$49.3m profit after recent losses
- After reporting losses in three of the last five quarters, Cimpress posted net income of US$49.3 million in Q2 2026, compared with a loss of US$25.3 million in Q4 2025 and a loss of US$8.2 million in Q3 2025. This highlights how lumpy profitability has been across recent periods.
- For a more optimistic view, this Q2 profit sits alongside trailing twelve month net income of US$23.4 million and EPS of US$0.95. This stands in heavy contrast to the earlier data point that earnings grew at 43.7% per year over five years and an estimated 76.35% yearly earnings growth going forward, so anyone positive on the outlook has to reconcile those strong growth figures with how often recent quarters have dipped into losses.
Thin 0.7% net margin with weak interest cover
- The trailing net profit margin sits at 0.7% versus 4.8% a year earlier, and the risk summary flags that earnings do not comfortably cover interest expense. Current profitability and interest coverage are both described as weak.
- Skeptics focus on this more negative angle because a 0.7% margin and flagged interest coverage risk mean even small hits to earnings could matter a lot. That concern is supported by the swing between profitable quarters like Q2 2026 and loss making quarters such as Q4 2025, while any more optimistic view built on strong modelled earnings growth has to contend with the fact that recent reported profitability and interest cover are still described as fragile.
High 82.2x P/E and DCF fair value gap
- Cimpress trades on a trailing P/E of 82.2x, well above the US Commercial Services industry at 25.9x and peers at 15.3x. The DCF fair value in the dataset is US$91.58 against a current share price of US$78.01, implying the price is about 14.8% below that DCF fair value estimate.
- For a more optimistic take, the DCF fair value sitting above the current price and an earnings growth estimate of 76.35% per year both point to upside in the models. However, the same data shows very low trailing margins, a P/E that is more than 3x the peer average and only modest forecast revenue growth of 3.3% per year versus 10.6% for the wider US market, so anyone leaning positive has to be comfortable paying a high multiple while the business is currently earning relatively little on each dollar of sales.
Next Steps
Don't just look at this quarter; the real story is in the long-term trend. We've done an in-depth analysis on Cimpress's growth and its valuation to see if today's price is a bargain. Add the company to your watchlist or portfolio now so you don't miss the next big move.
See What Else Is Out There
Cimpress combines thin 0.7% trailing net margins, weak interest coverage and lumpy profits that have swung between losses and modest earnings.
If that mix of fragile profitability and debt costs feels uncomfortable, check out our solid balance sheet and fundamentals stocks screener (389 results) today to focus on companies built on stronger financial footing.
This article by Simply Wall St is general in nature. We provide commentary based on historical data and analyst forecasts only using an unbiased methodology and our articles are not intended to be financial advice. It does not constitute a recommendation to buy or sell any stock, and does not take account of your objectives, or your financial situation. We aim to bring you long-term focused analysis driven by fundamental data. Note that our analysis may not factor in the latest price-sensitive company announcements or qualitative material. Simply Wall St has no position in any stocks mentioned.