In One Chart | Is the AI Rally Just Beginning? Wall Street Names 10 Must-Buy Stocks
Sahm Platform 03/12 06:36
Comparing Microsoft With Industry Competitors In Software Industry
Microsoft Corporation MSFT | 0.00 |
In today's rapidly evolving and fiercely competitive business landscape, it is crucial for investors and industry analysts to conduct comprehensive company evaluations. In this article, we will undertake an in-depth industry comparison, assessing Microsoft (NASDAQ:MSFT) alongside its primary competitors in the Software industry. By meticulously examining crucial financial indicators, market positioning, and growth potential, we aim to provide valuable insights to investors and shed light on company's performance within the industry.
Microsoft develops and licenses consumer and enterprise software. It is known for its Windows operating systems and Office productivity suite. The company is organized into three equally sized broad segments: productivity and business processes (legacy Microsoft Office, cloud-based Office 365, Exchange, SharePoint, Skype, LinkedIn, Dynamics), intelligence cloud (infrastructure- and platform-as-a-service offerings Azure, Windows Server OS, SQL Server), and more personal computing (Windows Client, Xbox, Bing search, display advertising, and Surface laptops, tablets, and desktops).
| Company | P/E | P/B | P/S | ROE | EBITDA (in billions) | Gross Profit (in billions) | Revenue Growth |
|---|---|---|---|---|---|---|---|
| Microsoft Corp | 35.15 | 10.50 | 12.58 | 8.27% | $40.71 | $48.15 | 13.27% |
| Oracle Corp | 36.93 | 26.37 | 8.06 | 19.27% | $5.89 | $9.94 | 6.4% |
| ServiceNow Inc | 137.82 | 20.74 | 18.50 | 4.66% | $0.72 | $2.44 | 18.63% |
| Palo Alto Networks Inc | 106.98 | 17.17 | 14.86 | 3.85% | $0.4 | $1.67 | 15.33% |
| Fortinet Inc | 42.64 | 40.41 | 13.05 | 25.08% | $0.56 | $1.25 | 13.77% |
| Gen Digital Inc | 26.95 | 7.59 | 4.40 | 6.43% | $0.53 | $0.81 | 4.77% |
| Monday.Com Ltd | 289.69 | 13.36 | 14.71 | 2.57% | $0.01 | $0.25 | 30.12% |
| CommVault Systems Inc | 104.40 | 23.81 | 7.96 | 10.11% | $0.03 | $0.23 | 23.17% |
| Dolby Laboratories Inc | 28.62 | 2.82 | 5.58 | 3.61% | $0.14 | $0.33 | 1.38% |
| Qualys Inc | 27.90 | 9.95 | 8.15 | 9.75% | $0.06 | $0.13 | 9.67% |
| Progress Software Corp | 48.25 | 6.11 | 3.38 | 2.51% | $0.07 | $0.19 | 28.88% |
| Teradata Corp | 15.66 | 13.36 | 1.26 | 30.24% | $0.09 | $0.25 | -10.11% |
| Rapid7 Inc | 56.12 | 28.04 | 1.71 | 5.98% | $0.02 | $0.15 | 2.51% |
| N-able Inc | 97 | 1.89 | 3.11 | -0.93% | $0.01 | $0.09 | 3.91% |
| Average | 78.38 | 16.28 | 8.06 | 9.47% | $0.66 | $1.36 | 11.42% |
When analyzing Microsoft, the following trends become evident:
The Price to Earnings ratio of 35.15 is 0.45x lower than the industry average, indicating potential undervaluation for the stock.
Considering a Price to Book ratio of 10.5, which is well below the industry average by 0.64x, the stock may be undervalued based on its book value compared to its peers.
The Price to Sales ratio of 12.58, which is 1.56x the industry average, suggests the stock could potentially be overvalued in relation to its sales performance compared to its peers.
The company has a lower Return on Equity (ROE) of 8.27%, which is 1.2% below the industry average. This indicates potential inefficiency in utilizing equity to generate profits, which could be attributed to various factors.
The company has higher Earnings Before Interest, Taxes, Depreciation, and Amortization (EBITDA) of $40.71 Billion, which is 61.68x above the industry average, indicating stronger profitability and robust cash flow generation.
The gross profit of $48.15 Billion is 35.4x above that of its industry, highlighting stronger profitability and higher earnings from its core operations.
The company's revenue growth of 13.27% is notably higher compared to the industry average of 11.42%, showcasing exceptional sales performance and strong demand for its products or services.
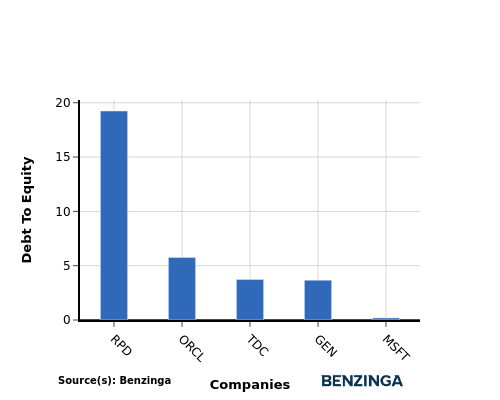
The debt-to-equity (D/E) ratio is a key indicator of a company's financial health and its reliance on debt financing.
Considering the debt-to-equity ratio in industry comparisons allows for a concise evaluation of a company's financial health and risk profile, aiding in informed decision-making.
By considering the Debt-to-Equity ratio, Microsoft can be compared to its top 4 peers, leading to the following observations:
Among its top 4 peers, Microsoft has a stronger financial position with a lower debt-to-equity ratio of 0.19.
This indicates that the company relies less on debt financing and maintains a more favorable balance between debt and equity, which can be viewed positively by investors.
For Microsoft in the Software industry, the PE and PB ratios suggest that the stock is undervalued compared to its peers. However, the high PS ratio indicates that the stock may be overvalued based on revenue. In terms of ROE, EBITDA, and gross profit, Microsoft outperforms its peers, indicating strong profitability and operational efficiency. Additionally, the high revenue growth rate further highlights Microsoft's strong position in the industry.
This article was generated by Benzinga's automated content engine and reviewed by an editor.

