
Please use a PC Browser to access Register-Tadawul
Get It
Corvus Pharmaceuticals (CRVS) Valuation Check After A Sharp Biotech Share Price Surge
Corvus Pharmaceuticals, Inc. CRVS | 17.82 | +3.54% |
Corvus Pharmaceuticals (CRVS) has drawn investor attention after a sharp share price move, with the stock up 7.35% in the latest session and posting significant gains over the past month.
The latest move sits within a very strong run, with a 30 day share price return of 201.33% and year to date share price return of 179.51%. The 1 year total shareholder return of 306.76% and very large 3 year total shareholder return suggest sentiment around Corvus Pharmaceuticals has shifted sharply, even after today’s 7.35% daily gain to $20.46.
If this kind of biotech volatility has your attention, it could be a good moment to see what else is moving and check out 26 healthcare AI stocks as a starting list of ideas.
With Corvus still loss making, trading at $20.46 and sitting at what looks like a large discount to a US$33.33 analyst target and intrinsic estimates, you have to ask: is there still a buying opportunity here, or is the market already pricing in future growth?
Corvus Pharmaceuticals is currently trading on a P/B of 23.9x, which looks rich when you compare it to both the US Biotechs industry and its direct peers.
The price to book ratio compares the company’s market value to its net assets. A higher P/B usually reflects strong optimism about future prospects or valuable intangible assets. For a business that is still loss making and reports no meaningful revenue, a P/B this high suggests the market is placing a lot of weight on the pipeline and future potential rather than current financials.
Against the wider US Biotechs industry average P/B of 2.6x and a peer average of 4.4x, Corvus stands out as materially more expensive on this metric. That gap is large, so any change in sentiment around its trial programs or funding needs could matter a lot for how comfortably this valuation sits.
Result: Price-to-book of 23.9x (OVERVALUED)
However, Corvus is still loss making, reporting a net loss of $15.075m and no revenue, so any setback in its clinical trials or funding plans could quickly challenge today’s rich P/B.
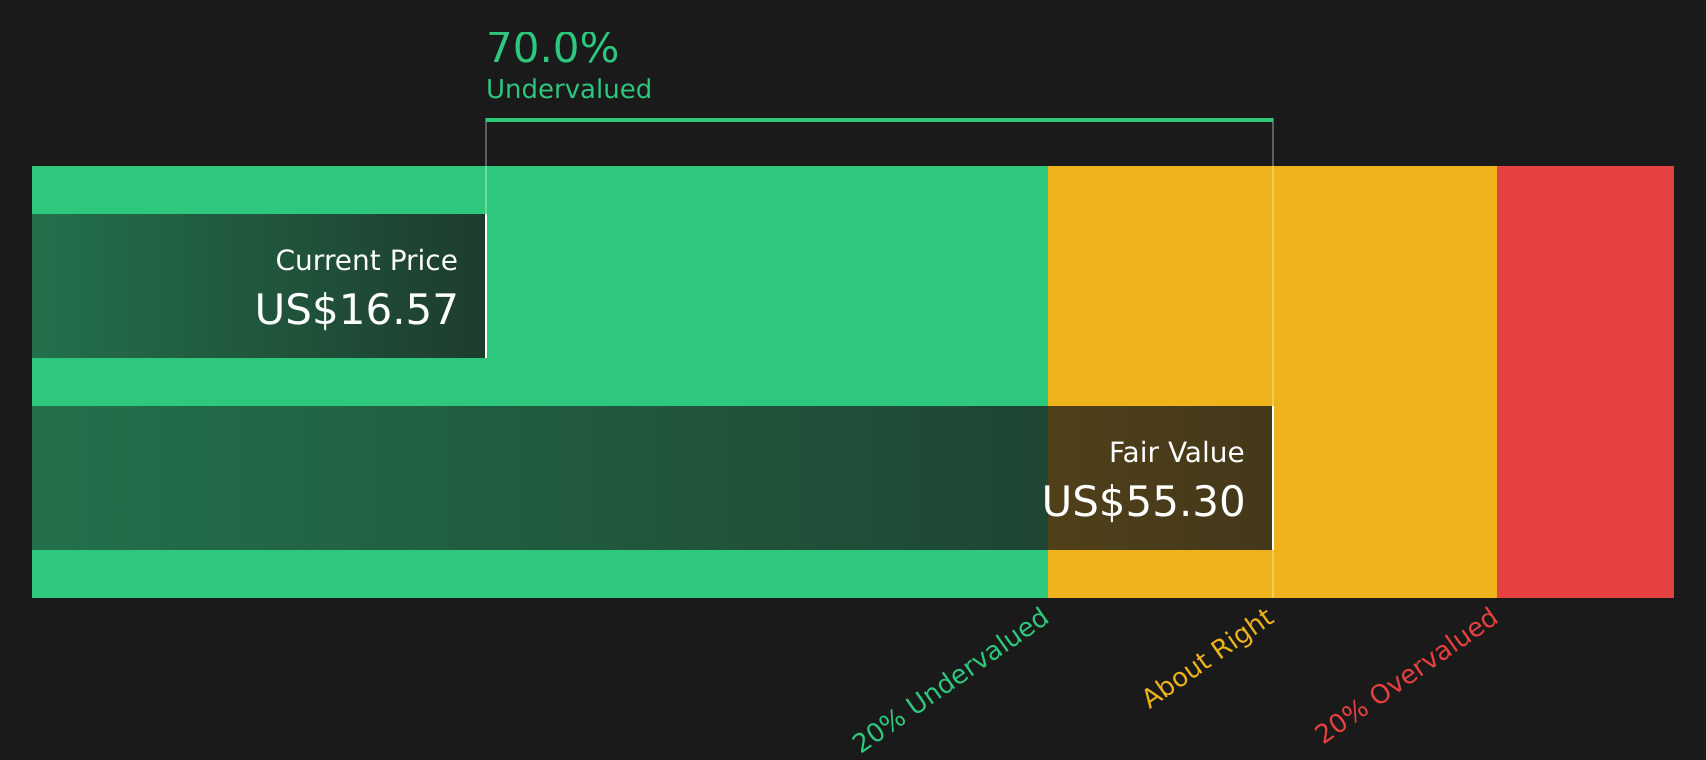
The rich 23.9x P/B makes Corvus look expensive on assets, but our DCF model points the other way, with an estimated future cash flow value of $55.06 versus the current $20.46 share price. One model says stretched, the other says undervalued. Which set of assumptions do you trust more?
Simply Wall St performs a discounted cash flow (DCF) on every stock in the world every day (check out Corvus Pharmaceuticals for example). We show the entire calculation in full. You can track the result in your watchlist or portfolio and be alerted when this changes, or use our stock screener to discover 52 high quality undervalued stocks. If you save a screener we even alert you when new companies match - so you never miss a potential opportunity.
If you look at the numbers and reach a different conclusion, or simply prefer to test your own assumptions, you can build a complete Corvus story yourself in just a few minutes, starting with Do it your way.
A great starting point for your Corvus Pharmaceuticals research is our analysis highlighting 2 key rewards and 4 important warning signs that could impact your investment decision.
If Corvus has sparked your interest, do not stop there, the real edge often comes from comparing it with other opportunities that fit your style and risk tolerance.
This article by Simply Wall St is general in nature. We provide commentary based on historical data and analyst forecasts only using an unbiased methodology and our articles are not intended to be financial advice. It does not constitute a recommendation to buy or sell any stock, and does not take account of your objectives, or your financial situation. We aim to bring you long-term focused analysis driven by fundamental data. Note that our analysis may not factor in the latest price-sensitive company announcements or qualitative material. Simply Wall St has no position in any stocks mentioned.
