
Please use a PC Browser to access Register-Tadawul
Get It
Could Recent 53% Drop in SM Energy Signal a Value Opportunity for 2025?
SM Energy Company SM | 21.08 | +7.88% |
The Discounted Cash Flow (DCF) model estimates a company’s intrinsic value by forecasting future cash flows and discounting them back to today's value. This approach provides a fundamental insight by considering the earnings SM Energy is expected to generate over time, rather than just current profits.
For SM Energy, the most recent Free Cash Flow stands at -$307.4 million. Looking ahead, analyst projections show recovery and growth, with Free Cash Flow forecast to reach $699 million in 2028. After that, further estimates are extrapolated through to 2035, continuing the upward trend. All cash flow figures are in US dollars ($) as SM Energy reports in this currency.
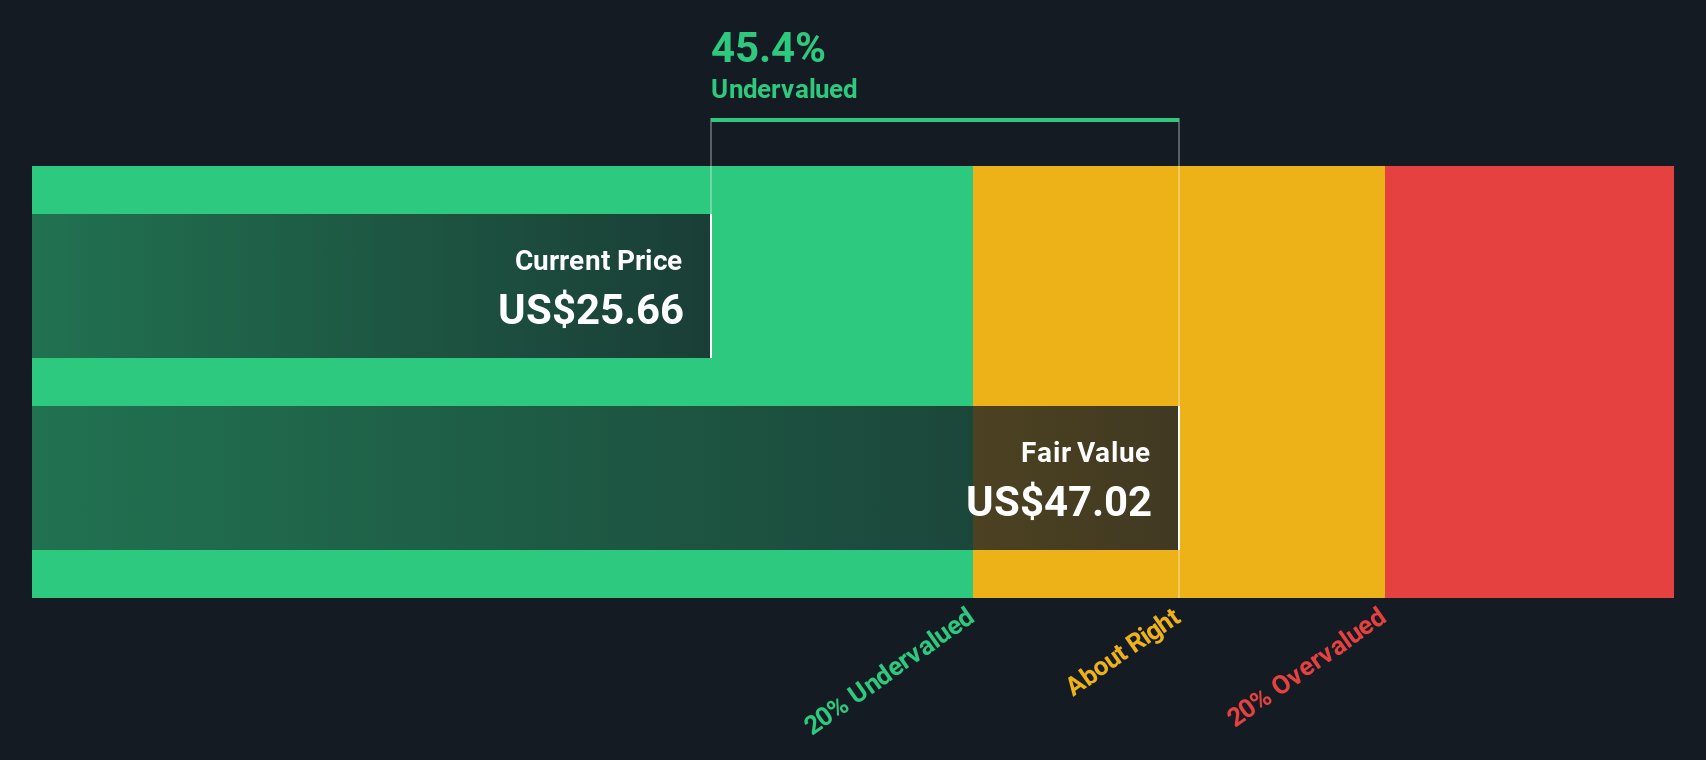
Based on this 2 Stage Free Cash Flow to Equity model, the intrinsic value of SM Energy is calculated at $111.81 per share. Compared to the current stock price, the DCF model suggests the stock trades at an 83.3% discount to intrinsic value, signaling strong undervaluation.
Result: UNDERVALUED
Our Discounted Cash Flow (DCF) analysis suggests SM Energy is undervalued by 83.3%. Track this in your watchlist or portfolio, or discover 840 more undervalued stocks based on cash flows.
The Price-to-Earnings (PE) ratio is a trusted yardstick for valuing profitable companies like SM Energy, as it links a company's share price to its per-share earnings. This makes it a relevant metric for comparing how the market values profitability across different firms.
Choosing a "normal" or "fair" PE ratio depends on several factors. Companies with strong future growth prospects or less risk can command higher PE ratios, whereas firms with uncertain outlooks or more risk typically trade at lower multiples. So, PE ratios should always be considered within the industry backdrop and the company's specific profile.
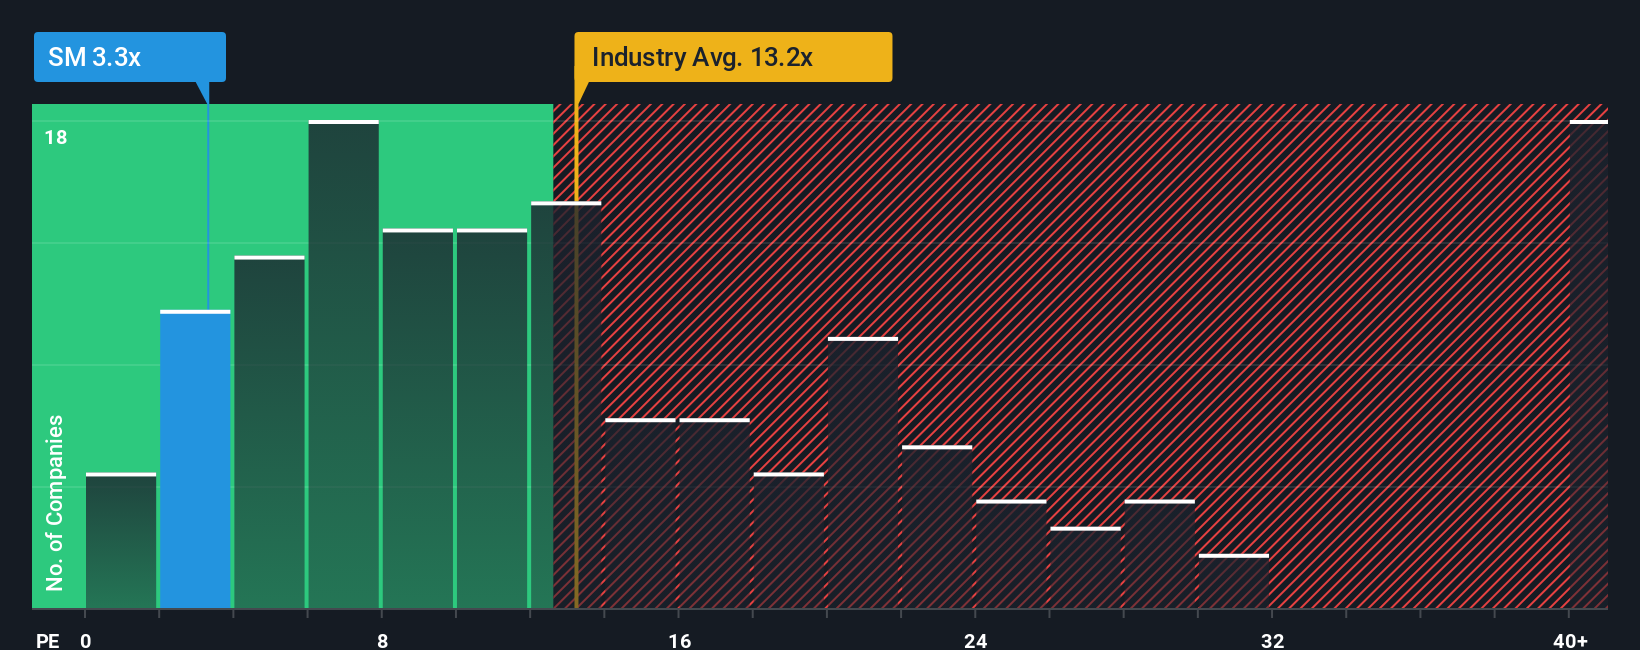
Currently, SM Energy trades at a PE ratio of 2.94x. This is dramatically lower than both the Oil and Gas industry average of 12.66x and the typical peer at 28.87x. However, numbers alone do not tell the full story.
Enter Simply Wall St’s proprietary “Fair Ratio,” which is a tailored benchmark that estimates the PE ratio a company should trade at, based on factors like expected earnings growth, risk profile, profit margin, industry characteristics, and company size. Unlike traditional benchmarks, the Fair Ratio goes beyond simple comparisons to offer a more personalized assessment.
For SM Energy, the Fair Ratio stands at 10.70x, which is well above its current PE. This suggests SM Energy is trading below what would be expected given its fundamentals and outlook, and could represent an attractive value opportunity.
Result: UNDERVALUED
PE ratios tell one story, but what if the real opportunity lies elsewhere? Discover 1411 companies where insiders are betting big on explosive growth.
Earlier we mentioned that there is an even better way to understand valuation, so let's introduce you to Narratives.
Narratives are a simple yet powerful tool that lets you combine your research, perspective, and beliefs about a company like SM Energy with the hard numbers, such as your estimates for future revenue, profit margins, and what you think is a fair value.
With a Narrative, you connect the company's real story to a forecast, helping you map how your outlook on operational trends, risks, and industry changes translates into a specific fair value estimate.
These Narratives are available on Simply Wall St’s Community page, making it easy and accessible for all investors to create, share, and follow different perspectives on SM Energy, just like the millions of people already using the platform.
Narratives allow you to quickly see how your view compares to the current market price, showing whether the stock looks undervalued or overvalued according to your logic, and keep you updated automatically when new data or news affects the company.
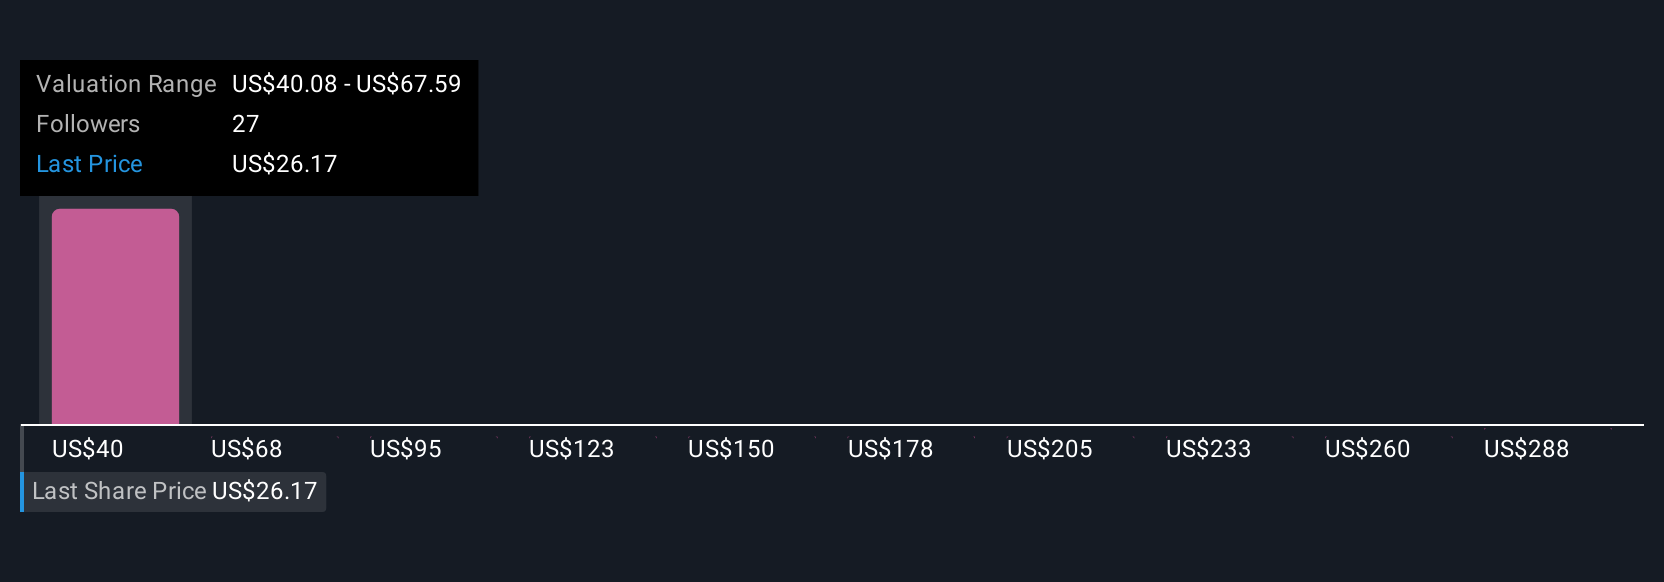
For example, some investors see SM Energy’s operational efficiency and strong balance sheet and assign a high fair value around $59 per share, while others worry about regional risks and falling margins, leading them to set a much lower target near $27. This demonstrates just how flexible and personal Narratives can be.
Do you think there's more to the story for SM Energy? Head over to our Community to see what others are saying!
This article by Simply Wall St is general in nature. We provide commentary based on historical data and analyst forecasts only using an unbiased methodology and our articles are not intended to be financial advice. It does not constitute a recommendation to buy or sell any stock, and does not take account of your objectives, or your financial situation. We aim to bring you long-term focused analysis driven by fundamental data. Note that our analysis may not factor in the latest price-sensitive company announcements or qualitative material. Simply Wall St has no position in any stocks mentioned.
