Coursera (COUR) has wrapped up FY 2025 with Q4 revenue of US$196.9 million and a basic EPS loss of US$0.16, alongside net income excluding extra items of a US$26.8 million loss, keeping the focus squarely on profitability progress. The company has seen quarterly revenue move from US$176.1 million in Q3 2024 to US$179.18 million in Q4 2024, then to US$179.3 million, US$187.1 million, US$194.2 million and now US$196.9 million. Over the same stretch, quarterly basic EPS losses have ranged between roughly US$0.05 and US$0.16, giving investors a detailed read on how top line scale and per share losses are evolving together. Taken as a whole, the latest print keeps margins in negative territory, so the story now is whether this level of growth can eventually close the gap to break even.
See our full analysis for Coursera.
With the headline numbers on the table, the next step is to see how this earnings profile lines up against the most common narratives around Coursera, highlighting where the data supports those views and where it pushes back.
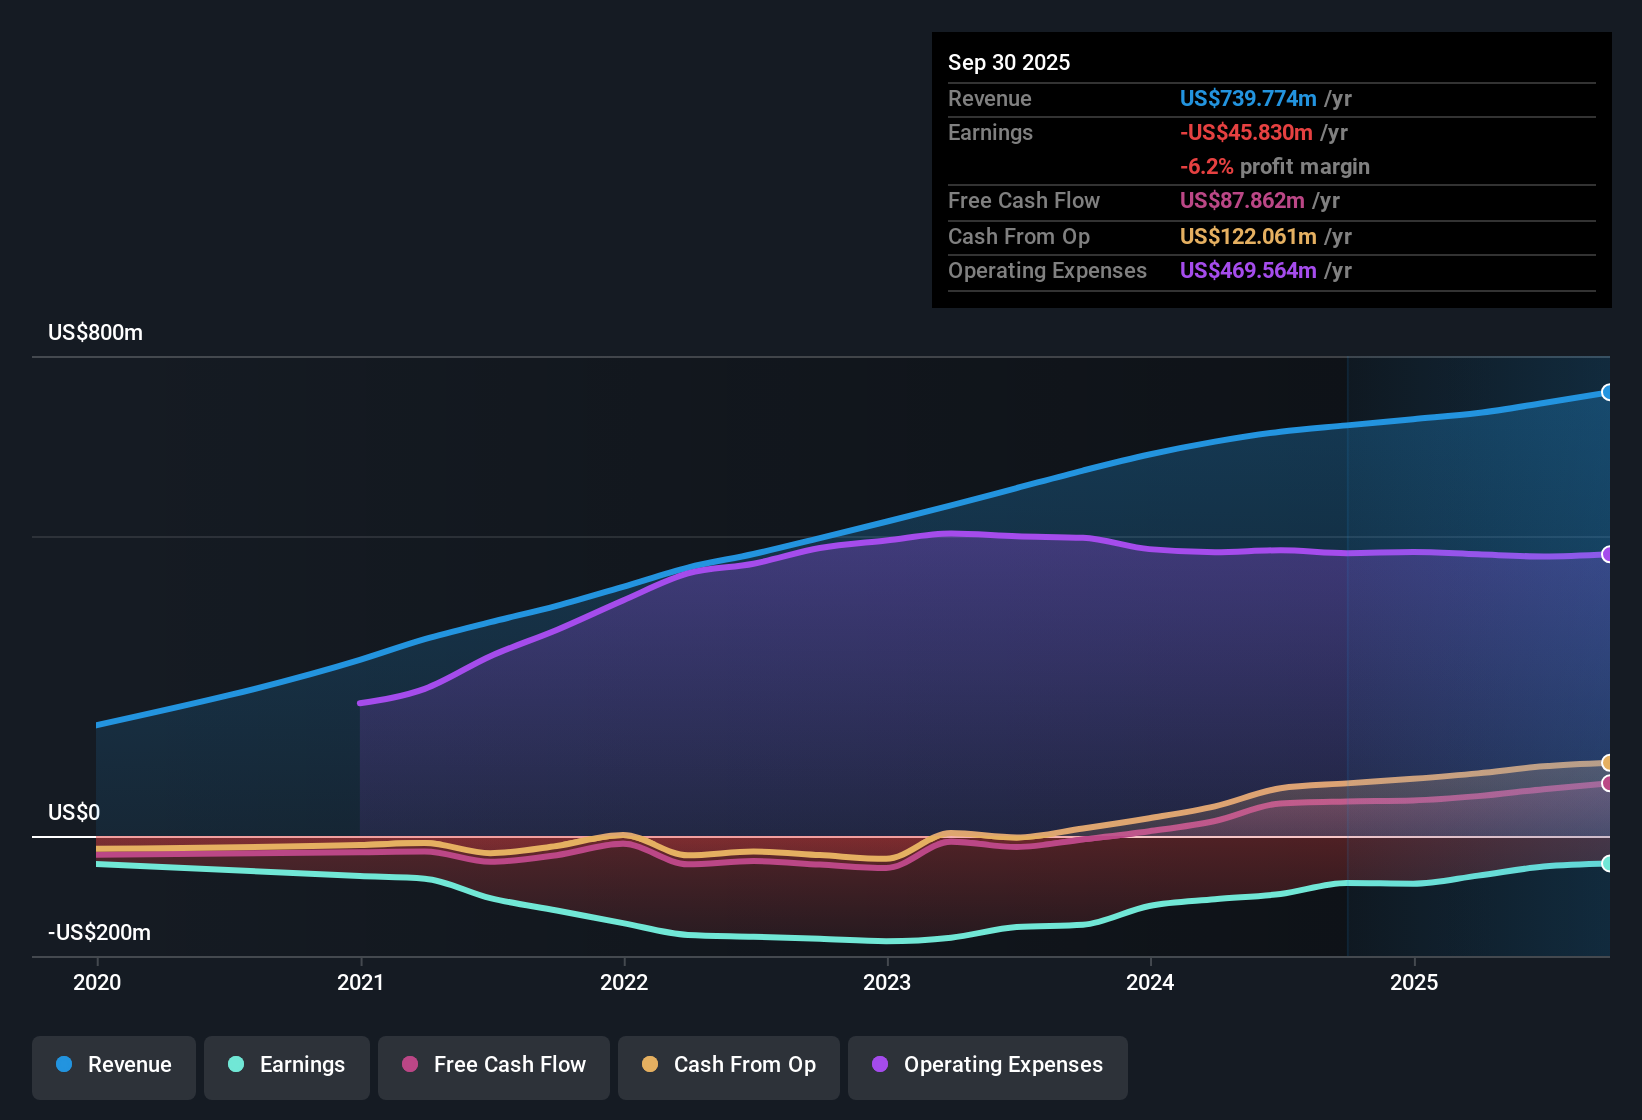
NYSE:COUR Earnings & Revenue History as at Feb 2026
Trailing 12 Months Still Show US$51 Million Loss
On a trailing 12 month basis to Q4 FY 2025, Coursera recorded US$757.5 million in revenue and a net loss excluding extra items of US$51 million, with basic EPS of US$0.31 loss over that period.
What stands out for a more optimistic view is that earnings losses have been improving at about 12.4% per year over the past five years, even though the company is still unprofitable. This means anyone leaning bullish is relying on this multi year trend rather than current profitability.
That five year improvement rate in losses sits alongside the latest trailing revenue base of US$757.5 million. Bulls are therefore pointing to a business that already has meaningful scale while still working through losses.
At the same time, the most recent quarterly loss of US$26.8 million in Q4 FY 2025 shows that progress on narrowing losses can be uneven from one quarter to the next. This keeps the bullish case focused on the longer trend rather than single period results.
Revenue Growing At 6.2% Versus 10.2% Market
The trailing and forecast revenue growth rate used in the analysis is 6.2% per year, which is slower than the 10.2% per year rate cited for the broader US market, so Coursera is growing but not matching that wider benchmark.
Bears often worry about slower growth stories. In this case they can point to that 6.2% rate versus 10.2% for the market and the continued lack of profitability as reasons to question how much operating leverage Coursera can pull from its US$757.5 million revenue base.
Critics highlight that even with quarterly revenue stepping from US$176.1 million in Q3 2024 to US$196.9 million in Q4 2025, the company is still reporting losses in every quarter shown. This keeps questions about earnings power front and center.
They can also connect the slower than market growth rate to the risk summary that explicitly flags no forecasted return to profit over the next three years, suggesting that extra growth may be needed before the income statement turns a corner.
P/S Of 1.3x And Big Gap To DCF Fair Value
The trailing 12 month analysis shows Coursera on a P/S of 1.3x, below the 1.5x peer average but slightly above the 1.2x US Consumer Services industry average, while the DCF fair value used in the model sits at US$17.62 per share compared with the current share price of US$5.91.
Supporters of a more bullish angle point to this valuation gap, arguing that a stock trading around 66.5% below the DCF fair value with a P/S below peers could be mispriced, even though the company is still loss making.
That view is backed by the combination of a US$51 million trailing 12 month loss that has been shrinking over several years and a revenue base of US$757.5 million, which some investors see as enough scale for future operating improvements to matter.
What complicates this bullish take is the clear risk flag that Coursera is expected to remain unprofitable over the next three years, so anyone leaning on the DCF fair value of US$17.62 is accepting that the model is more optimistic than the current market pricing at US$5.91.
To see how these numbers fit into a broader story around growth, risks, and valuation for Coursera, you might find a full narrative especially useful here:
📊 Read the full Coursera Consensus Narrative.
Next Steps
Don't just look at this quarter; the real story is in the long-term trend. We've done an in-depth analysis on Coursera's growth and its valuation to see if today's price is a bargain. Add the company to your watchlist or portfolio now so you don't miss the next big move.
See What Else Is Out There
Coursera is still recording sizeable losses, growing revenue more slowly than the wider US market and is not expected to reach profitability within the next three years.
If those ongoing losses and slower growth rates make you cautious, it could be worth shifting your attention to 86 resilient stocks with low risk scores that aim to prioritise resilience and steadier financial profiles.
This article by Simply Wall St is general in nature. We provide commentary based on historical data and analyst forecasts only using an unbiased methodology and our articles are not intended to be financial advice. It does not constitute a recommendation to buy or sell any stock, and does not take account of your objectives, or your financial situation. We aim to bring you long-term focused analysis driven by fundamental data. Note that our analysis may not factor in the latest price-sensitive company announcements or qualitative material. Simply Wall St has no position in any stocks mentioned.