Darling Ingredients (DAR) has wrapped up FY 2025 with fourth quarter revenue of US$1.7b and basic EPS of US$0.36, putting a clearer marker on how the year has played out. The company has seen revenue move from US$1.4b in Q4 2024 to US$1.7b in Q4 2025, while quarterly basic EPS shifted from US$0.64 to US$0.36 across the same period, setting the backdrop for investors focused on earnings quality. With trailing twelve month EPS at US$0.40 and a net profit margin of 1% versus 4.8% in the prior year, the latest release raises pointed questions about how durable the margin profile really is.
See our full analysis for Darling Ingredients.
With the numbers on the table, the next step is to line them up against the most common stories around Darling Ingredients, testing which narratives still hold and which begin to crack under the latest margin and earnings trends.
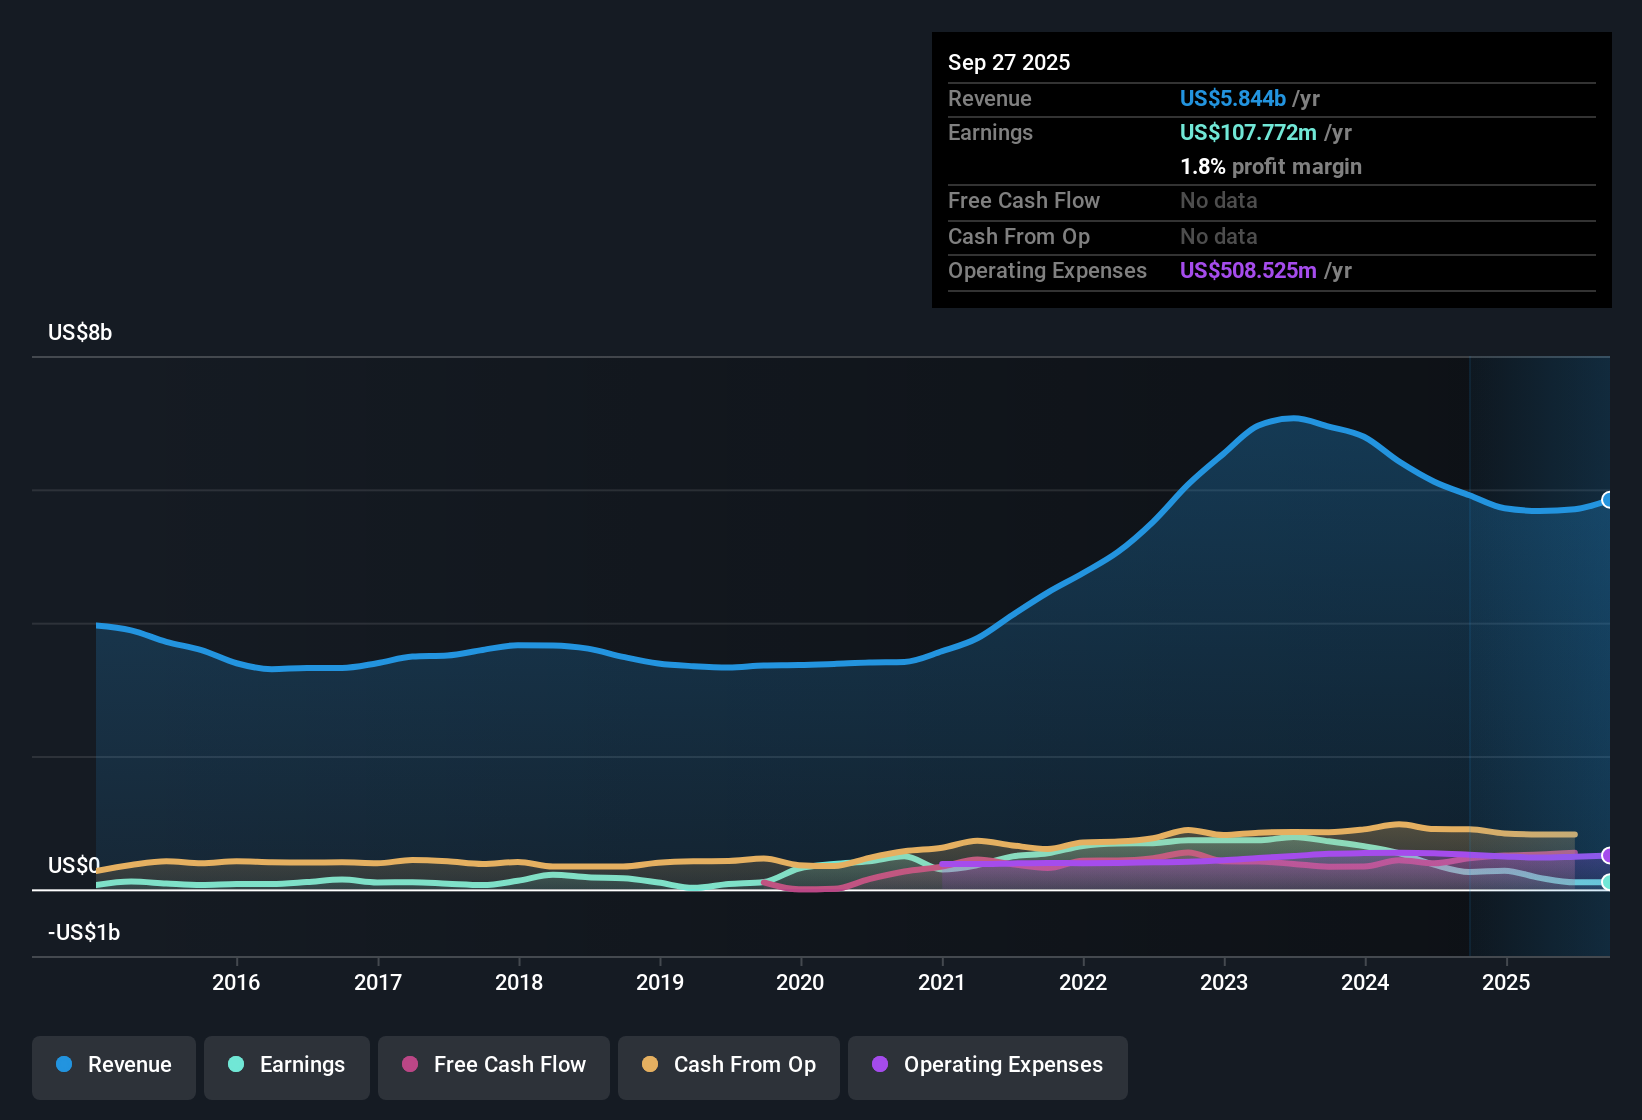
NYSE:DAR Earnings & Revenue History as at Feb 2026
TTM profit falls to US$62.8m on thinner margins
Over the last twelve months, Darling Ingredients earned net income of US$62.8 million on US$6.1 billion of revenue, which works out to a 1% net margin compared with 4.8% in the prior year.
Consensus narrative expects margins to improve over time, yet the recent numbers show pressure that investors should weigh against that view.
Analysts are assuming profit margins rise from 1.8% to 10.4% in about three years, while current trailing margins sit at 1%. This implies the business would need a large shift in profitability from where it is today.
Trailing earnings also include a US$94.6 million one off loss, which helps explain why EPS over the last year is US$0.40 even though quarterly revenue reached US$1.7 billion in Q4 2025.
Revenue forecast of 2.9% a year vs 10.4% market pace
Revenue growth is forecast at 2.9% per year, which is below the 10.4% per year forecast for the wider US market, even though quarterly sales went from US$1.4 billion in Q4 2024 to US$1.7 billion in Q4 2025.
Bulls focus on new products and policy support, and the current sales profile partly lines up with that story but also leaves questions.
Bullish analysts are working with revenue growth of 5.8% a year and expect revenues of about US$6.8 billion by 2028, which is only a modest step up from the US$6.1 billion trailing tally.
They also argue that platforms like premium collagen and Nextida could support multi year revenue and EBITDA growth, yet the latest reported net income of US$56.9 million in Q4 2025 on US$1.7 billion of revenue still reflects tight margins today.
Have a look at how bullish analysts connect those growth ideas to the numbers in their full narrative on Darling Ingredients, and see where you agree or disagree with their assumptions.
🐂 Darling Ingredients Bull Case
P/E of 126.7x and DCF fair value of US$146.54
At a share price of US$50.31, Darling Ingredients is on a trailing P/E of 126.7x versus a US Food industry average of 23.9x and a peer average of 23.5x, while the DCF fair value is listed at US$146.54.
Bears point to high leverage and weak interest coverage, and the trailing valuation multiples give that cautious view some backing.
Interest expense coverage is described as weak, with interest payments not well covered by earnings, which is consistent with trailing net income of US$62.8 million on US$6.1 billion of revenue.
At the same time, the model suggests earnings could grow about 48.2% a year and that the current price is about 65.7% below the DCF fair value of US$146.54. The cautious stance therefore has to be weighed against that modeled upside.
If you are trying to weigh those credit concerns against the high P/E and the modeled upside, it is worth reading how skeptics frame the risk and return trade off in their full bear case on Darling Ingredients.
🐻 Darling Ingredients Bear Case
Next Steps
To see how these results tie into long-term growth, risks, and valuation, check out the full range of community narratives for Darling Ingredients on Simply Wall St. Add the company to your watchlist or portfolio so you'll be alerted when the story evolves.
See the numbers differently? Take that view, put it to the test against the data in just a few minutes, and start shaping your own story today. Do it your way
A great starting point for your Darling Ingredients research is our analysis highlighting 2 key rewards and 3 important warning signs that could impact your investment decision.
See What Else Is Out There
With net margins at 1%, a P/E of 126.7x and weak interest coverage, Darling Ingredients pairs thin profitability with a stretched valuation profile.
If that mix of tight margins, leverage concerns and a high earnings multiple feels uncomfortable, compare it with companies in our 85 resilient stocks with low risk scores that prioritize resilient balance sheets and steadier risk profiles today.
This article by Simply Wall St is general in nature. We provide commentary based on historical data and analyst forecasts only using an unbiased methodology and our articles are not intended to be financial advice. It does not constitute a recommendation to buy or sell any stock, and does not take account of your objectives, or your financial situation. We aim to bring you long-term focused analysis driven by fundamental data. Note that our analysis may not factor in the latest price-sensitive company announcements or qualitative material. Simply Wall St has no position in any stocks mentioned.