
Please use a PC Browser to access Register-Tadawul
Get It
Despite the downward trend in earnings at Winnebago Industries (NYSE:WGO) the stock climbs 9.7%, bringing five-year gains to 55%
Winnebago Industries, Inc. WGO | 39.24 | -1.75% |
When you buy and hold a stock for the long term, you definitely want it to provide a positive return. Better yet, you'd like to see the share price move up more than the market average. But Winnebago Industries, Inc. (NYSE:WGO) has fallen short of that second goal, with a share price rise of 45% over five years, which is below the market return. The last year has been disappointing, with the stock price down 17% in that time.
Since it's been a strong week for Winnebago Industries shareholders, let's have a look at trend of the longer term fundamentals.
In his essay The Superinvestors of Graham-and-Doddsville Warren Buffett described how share prices do not always rationally reflect the value of a business. By comparing earnings per share (EPS) and share price changes over time, we can get a feel for how investor attitudes to a company have morphed over time.
Winnebago Industries' earnings per share are down 3.1% per year, despite strong share price performance over five years.
By glancing at these numbers, we'd posit that the decline in earnings per share is not representative of how the business has changed over the years. Since the change in EPS doesn't seem to correlate with the change in share price, it's worth taking a look at other metrics.
In contrast revenue growth of 12% per year is probably viewed as evidence that Winnebago Industries is growing, a real positive. It's quite possible that management are prioritizing revenue growth over EPS growth at the moment.
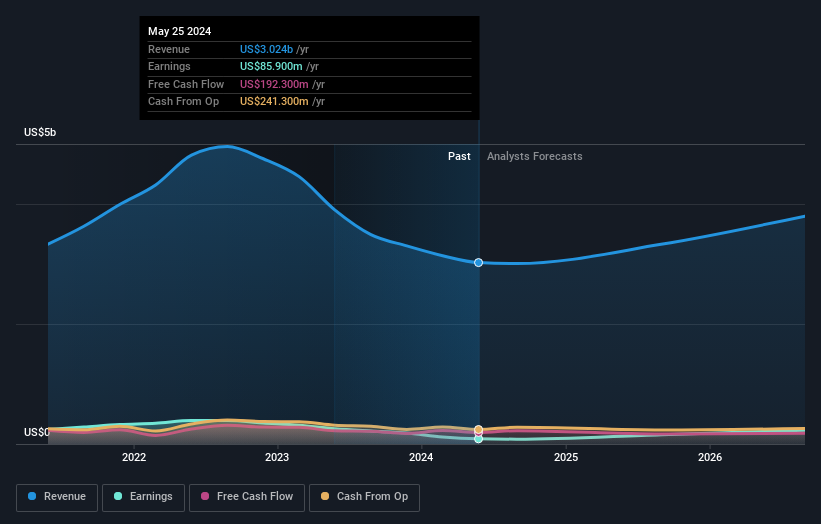
You can see how earnings and revenue have changed over time in the image below (click on the chart to see the exact values).
Winnebago Industries is well known by investors, and plenty of clever analysts have tried to predict the future profit levels. So we recommend checking out this free report showing consensus forecasts
As well as measuring the share price return, investors should also consider the total shareholder return (TSR). The TSR is a return calculation that accounts for the value of cash dividends (assuming that any dividend received was reinvested) and the calculated value of any discounted capital raisings and spin-offs. So for companies that pay a generous dividend, the TSR is often a lot higher than the share price return. As it happens, Winnebago Industries' TSR for the last 5 years was 55%, which exceeds the share price return mentioned earlier. And there's no prize for guessing that the dividend payments largely explain the divergence!
Investors in Winnebago Industries had a tough year, with a total loss of 15% (including dividends), against a market gain of about 24%. However, keep in mind that even the best stocks will sometimes underperform the market over a twelve month period. On the bright side, long term shareholders have made money, with a gain of 9% per year over half a decade. If the fundamental data continues to indicate long term sustainable growth, the current sell-off could be an opportunity worth considering. I find it very interesting to look at share price over the long term as a proxy for business performance. But to truly gain insight, we need to consider other information, too. Even so, be aware that Winnebago Industries is showing 2 warning signs in our investment analysis , you should know about...
Of course Winnebago Industries may not be the best stock to buy. So you may wish to see this free collection of growth stocks.
Please note, the market returns quoted in this article reflect the market weighted average returns of stocks that currently trade on American exchanges.
This article by Simply Wall St is general in nature. We provide commentary based on historical data and analyst forecasts only using an unbiased methodology and our articles are not intended to be financial advice. It does not constitute a recommendation to buy or sell any stock, and does not take account of your objectives, or your financial situation. We aim to bring you long-term focused analysis driven by fundamental data. Note that our analysis may not factor in the latest price-sensitive company announcements or qualitative material. Simply Wall St has no position in any stocks mentioned.
