DexCom (DXCM) Margin Expansion To 17.9% Reinforces Bullish Earnings Narratives
DexCom, Inc. DXCM | 61.23 61.23 | -0.50% 0.00% Pre |
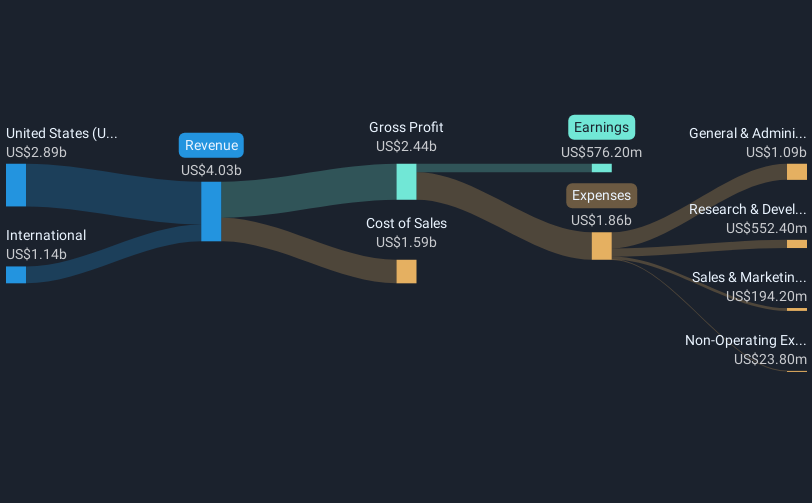
DexCom (DXCM) has wrapped up FY 2025 with fourth quarter revenue of US$1.3b and basic EPS of US$0.69, capping a year where trailing twelve month revenue reached US$4.7b and EPS came in at US$2.14. Over the past six reported quarters, the company has seen quarterly revenue move from US$994.2m in Q3 2024 to US$1.3b in Q4 2025, with basic EPS ranging from US$0.27 in Q1 2025 to US$0.73 in Q3 2025. This gives investors a clear view of how the top line and per share earnings have evolved through the year. With trailing net profit margins up from 14.3% to 17.9%, this latest earnings print puts profitability quality and its drivers front and center for anyone following the story.
See our full analysis for DexCom.With the headline numbers on the table, the next step is to see how this earnings profile lines up against the dominant bulls versus bears narratives that have built up around DexCom in recent months.
45.1% earnings growth backs higher margins
- Over the last 12 months, DexCom generated US$836.3 million of net income on US$4.7b of revenue, which translates to a 17.9% net margin compared with 14.3% a year earlier and sits alongside 45.1% earnings growth.
- What stands out for the bullish camp is how this higher 17.9% margin and 45.1% earnings growth line up with the story of expanding reimbursement and wider CGM adoption. However, they also need to weigh that analysts expect revenue to grow about 10.6% per year and earnings around 16.78% per year, which is slower than the most recent 12 month earnings growth.
- Supportive for bulls, trailing basic EPS of US$2.14 on a US$70.02 share price implies a 32.2x P/E, which is below the 36.5x peer average quoted in the data.
- On the other hand, the stronger recent earnings growth rate versus forward forecasts means bullish investors are relying on margin levels around 17.9% to hold up while growth moderates.
Quarterly earnings steady around US$260m to US$280m
- Across 2025, quarterly net income moved from US$105.4 million in Q1 to US$179.8 million in Q2, then to US$283.8 million in Q3 and US$267.3 million in Q4, so the back half of the year sat in a relatively tight US$260 million to US$280 million range.
- Bears focus on pressures like potential CMS competitive bidding and rising competition, and this pattern of Q3 net income of US$283.8 million followed by US$267.3 million in Q4 gives them concrete numbers to point to when they argue that future pricing or cost items could limit how far margins can move above the current 17.9% level.
- Critics highlight that any pricing pressure on the Medicare fee for service segment, which is cited as 15% of revenue, would hit that quarterly net income band directly if it reduced revenue or raised costs.
- They also link the risk of higher operational costs from supply chain issues to this recent earnings plateau, since additional logistics or production expenses would reduce the net income figures that sit behind the current 32.2x P/E.
Premium to DCF, but below peer P/E
- With the share price at US$70.02, DexCom trades above the stated DCF fair value of US$64.05 and on a 32.2x P/E, which is slightly above the 30.4x medical equipment industry average but below the 36.5x peer average, while analysts as a group point to a price target of US$85.27.
- Analysts' consensus view leans toward earnings and revenue growth supporting that US$85.27 target. However, the gap between the current price and the DCF fair value means investors are effectively siding with the idea that 10.6% forecast revenue growth and 16.78% forecast earnings growth justify paying more than the DCF output today.
- Supporters of the consensus argument point to the move in trailing net margin from 14.3% to 17.9% and US$4.7b of trailing revenue as signals that the business is already operating closer to the higher margin profile baked into forward assumptions.
- More cautious investors look at the current US$70.02 price above the US$64.05 DCF fair value and slightly above industry P/E and see a setup where any slip in the 45.1% trailing earnings growth rate could make that premium harder to justify against the US$85.27 target.
Next Steps
To see how these results tie into long-term growth, risks, and valuation, check out the full range of community narratives for DexCom on Simply Wall St. Add the company to your watchlist or portfolio so you'll be alerted when the story evolves.
See the numbers differently? If the figures point you in a different direction, shape that view into a clear narrative in just a few minutes, Do it your way
A good starting point is our analysis highlighting 3 key rewards investors are optimistic about regarding DexCom.
See What Else Is Out There
DexCom’s current share price above the stated DCF fair value and slightly above the industry P/E leaves little room for error if earnings momentum cools.
If that kind of valuation premium makes you uneasy, you might feel more comfortable starting with 53 high quality undervalued stocks that screen for companies priced with a clearer margin of safety.
This article by Simply Wall St is general in nature. We provide commentary based on historical data and analyst forecasts only using an unbiased methodology and our articles are not intended to be financial advice. It does not constitute a recommendation to buy or sell any stock, and does not take account of your objectives, or your financial situation. We aim to bring you long-term focused analysis driven by fundamental data. Note that our analysis may not factor in the latest price-sensitive company announcements or qualitative material. Simply Wall St has no position in any stocks mentioned.