
Please use a PC Browser to access Register-Tadawul
Get It
Does AppLovin’s 76% Rally in 2025 Still Offer Upside for Investors?
AppLovin APP | 458.67 | +2.08% |
If you have been watching AppLovin stock, you are probably wondering what to make of those jaw-dropping returns and the bumps along the way. With shares closing at 602.3 and a climb of 76.2% so far this year, AppLovin has been an undeniable outperformer. Looking even further back, the 1-year move of 315.8% and a staggering 3,353.6% jump over the last three years are enough to make any investor sit up and take notice. Yet, the past month shows a more tempered pace, up a modest 1.5%, while last week dipped by 4.4% as the broader market digested the latest technology sector developments and shifting investor risk appetite.
These moves have some wondering whether all the growth has already been priced in, or if new opportunities may still emerge. Interestingly, if you look at traditional valuation checks, AppLovin scores a 0 out of 6 for being undervalued. In other words, none of the common valuation signals currently suggest a bargain at today’s levels. But as you probably suspect, there is more to the story. A closer look at the different approaches to valuation should help clarify if AppLovin is truly out of reach or just getting started. Be sure to stick around, because at the end of this article, we will explore a smarter way to understand what valuation really means for your investment decisions.
AppLovin scores just 0/6 on our valuation checks. See what other red flags we found in the full valuation breakdown.
The Discounted Cash Flow (DCF) model estimates a company's intrinsic value by forecasting its future cash flows and then discounting those cash flows back to today’s value. This method is favored for its focus on real money the business generates, rather than just accounting profits.
AppLovin’s latest reported Free Cash Flow (FCF) stands at $2.89 billion, reflecting strong operating performance. Analyst consensus projects continued growth, with FCF expected to reach $4.47 billion by 2026 and $7.32 billion by the end of 2029. After analysts’ five-year estimates, further projections up to 2035 are extrapolated using growth assumptions by Simply Wall St. This reinforces the view that cash generation will continue to rise over the next decade.
However, when those future billions in cash flow are discounted back to their present value, the estimated intrinsic value per share comes out to $420.55. With the current share price closing at $602.30, this suggests AppLovin is trading at a 43.2% premium to its fair value based on these cash flow forecasts.
Result: OVERVALUED
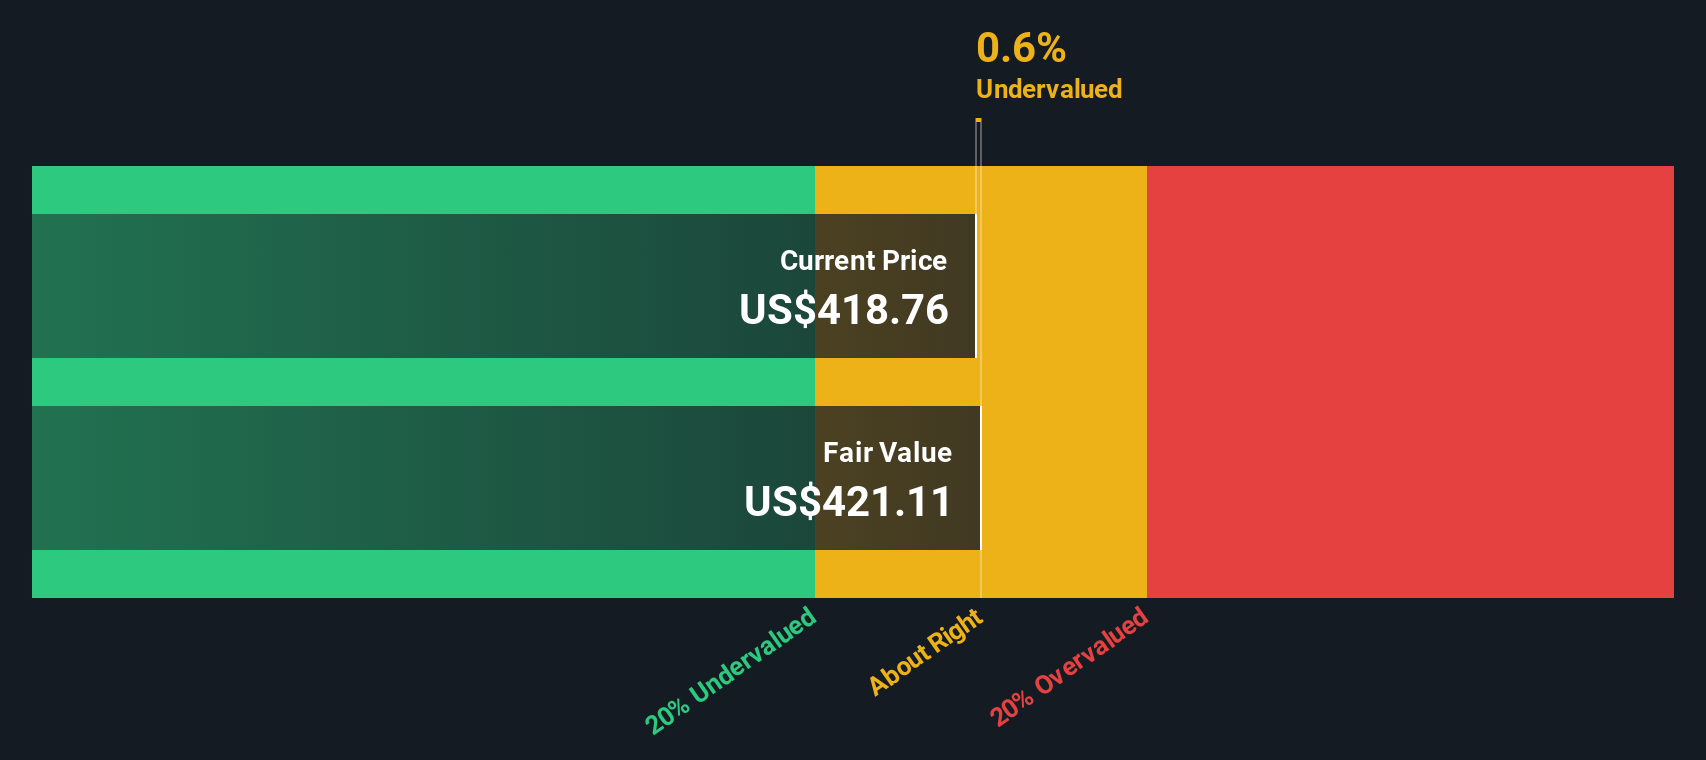
Our Discounted Cash Flow (DCF) analysis suggests AppLovin may be overvalued by 43.2%. Find undervalued stocks or create your own screener to find better value opportunities.
The Price-to-Earnings (PE) ratio is a widely used metric for evaluating profitable companies like AppLovin, as it relates the company's share price to its actual earnings. This ratio gives investors a quick way to gauge whether a stock seems expensive or cheap relative to the profits it generates.
It's important to remember that what counts as a "normal" or "fair" PE ratio depends on several factors. Companies with strong earnings growth prospects or lower risks generally deserve higher PE ratios, as investors are willing to pay a premium for future growth and stability. Conversely, companies facing higher risks or slower growth often trade at lower multiples.
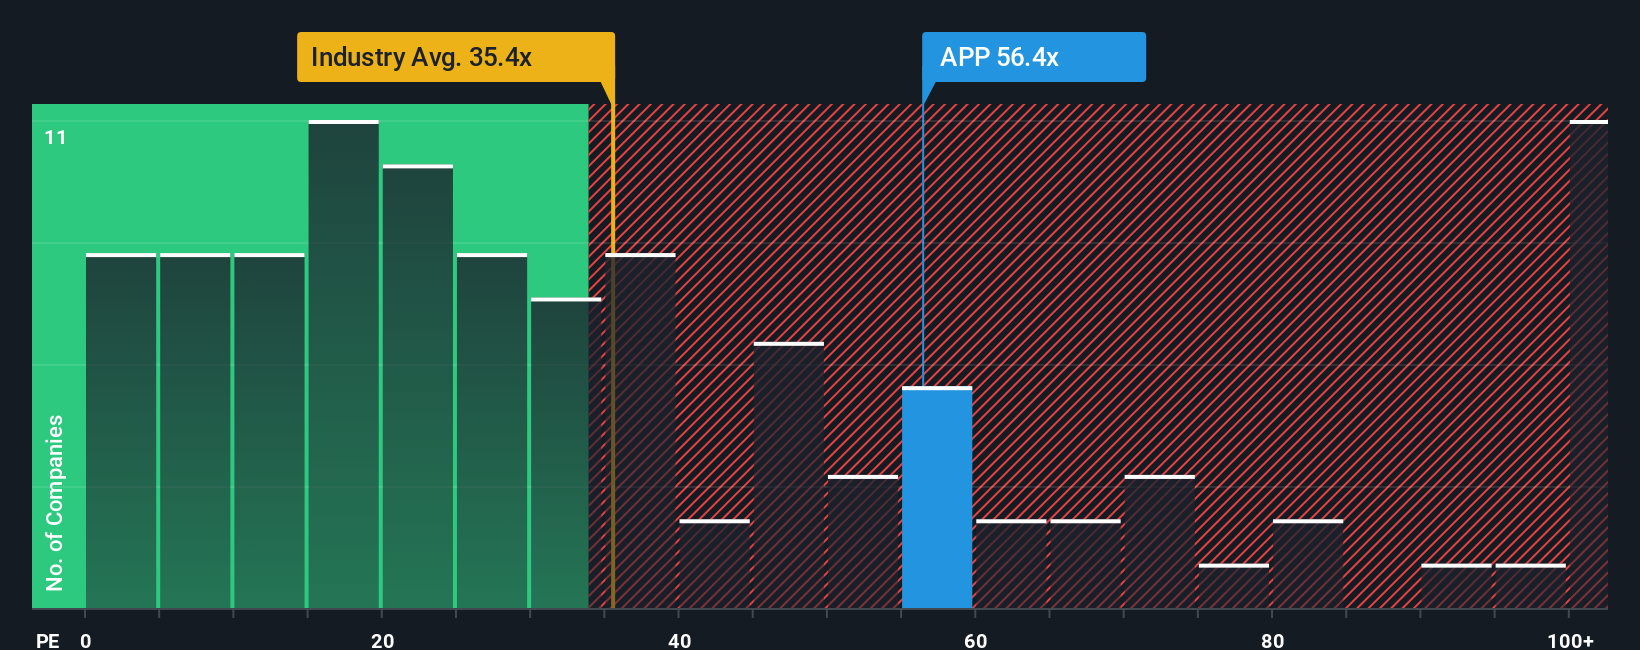
AppLovin's current PE ratio stands at 81.05x. To put that in perspective, this is much higher than the broader software industry average of 34.92x and also exceeds the average for direct peers, which is 47.00x. However, relying solely on these benchmarks can be misleading since they do not account for AppLovin’s unique characteristics, such as its robust earnings growth, profit margins, specific industry positioning, or scale.
This is where Simply Wall St's “Fair Ratio” comes in, calculated here as 57.01x. This proprietary measure considers the business’s growth prospects, profitability, industry, market cap, and risk profile. This provides a more nuanced and relevant benchmark than just using the industry or peers alone.
When comparing the Fair Ratio to AppLovin’s current PE, the actual multiple is notably above what would be considered reasonable given its fundamentals. This suggests that, at present, AppLovin stock is trading at a premium relative to its expected growth, risk, and profitability profile.
Result: OVERVALUED
PE ratios tell one story, but what if the real opportunity lies elsewhere? Discover companies where insiders are betting big on explosive growth.
Earlier, we mentioned that there is an even better way to understand valuation. Let's introduce you to Narratives. A Narrative is your personal story or perspective about a company, connecting what you believe about AppLovin’s future, including revenue, earnings, and profit margins, to a clear financial forecast and an assumed fair value.
Narratives link the “why” behind your investment thesis with the numbers, helping you see how your viewpoint translates directly into what you think the stock is really worth. It is a simple, accessible tool available right on Simply Wall St’s Community page, empowering millions of investors to share their scenarios and sense-check their decisions based on their convictions.
This approach helps you decide when to buy or sell by showing how your Fair Value compares to the current market Price. Best of all, Narratives dynamically update when new information, such as earnings or major news, comes out. This means your view is always up to date and stays relevant.
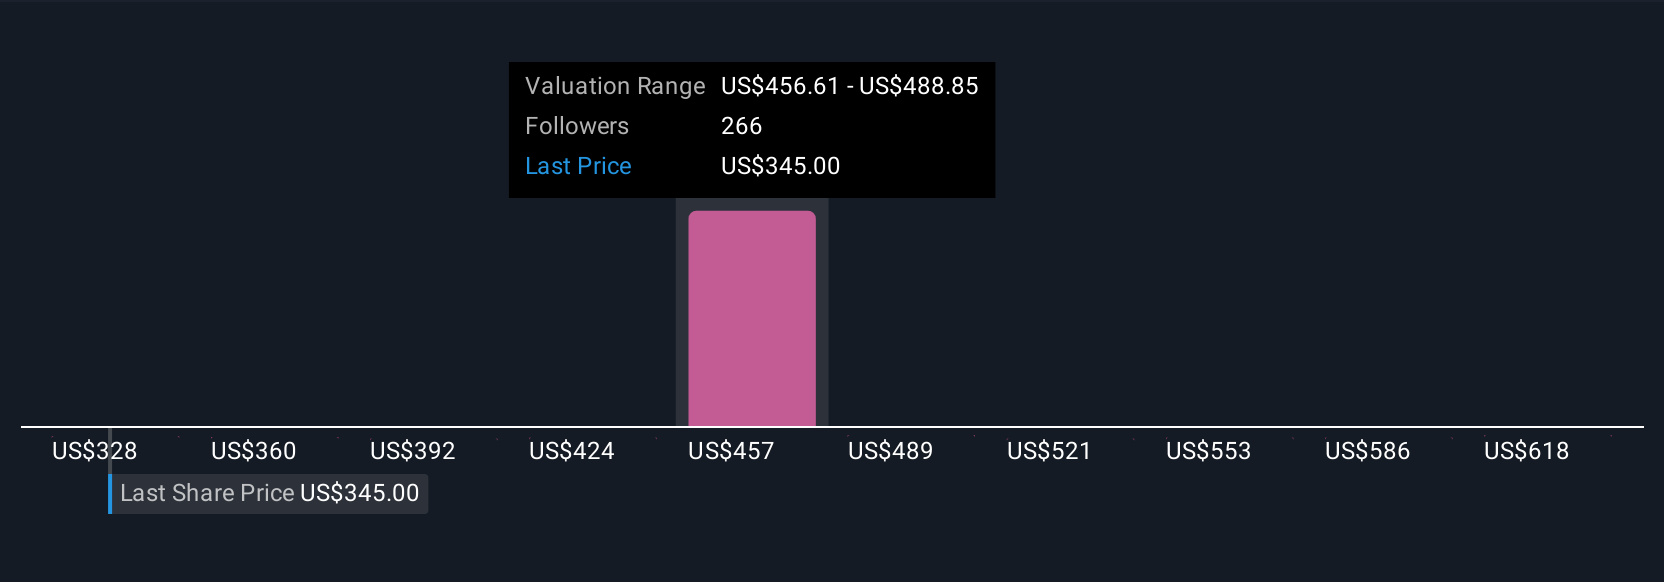
For example, if you believe AppLovin’s global expansion and new products will unlock sustained hyper-growth, your Narrative might point to a Fair Value near the current bullish analyst target of $650. On the other hand, a more cautious perspective considering regulatory and competitive risks might lead you to a Fair Value closer to the bearish end at $250.
Do you think there's more to the story for AppLovin? Create your own Narrative to let the Community know!
This article by Simply Wall St is general in nature. We provide commentary based on historical data and analyst forecasts only using an unbiased methodology and our articles are not intended to be financial advice. It does not constitute a recommendation to buy or sell any stock, and does not take account of your objectives, or your financial situation. We aim to bring you long-term focused analysis driven by fundamental data. Note that our analysis may not factor in the latest price-sensitive company announcements or qualitative material. Simply Wall St has no position in any stocks mentioned.
