
Please use a PC Browser to access Register-Tadawul
Get It
Does Citigroup’s 37% Rally in 2025 Signal Room for Long-Term Growth?
Citigroup Inc. C | 111.80 | +0.05% |
If you are mulling over your Citigroup shares or considering jumping in, you are not alone. Plenty of investors are weighing up their next move with this Wall Street heavyweight. After a sharp climb this year, Citigroup's stock has backed off a bit lately. Over the past week and month, shares dipped by 2.0% and 3.4% respectively, giving some investors pause. Still, put that volatility in context and you will see that Citigroup has posted an impressive 37.4% gain so far this year, 50.1% over the last 12 months, and a remarkable 169.5% over five years.
A closer look at these numbers hints at shifting investor sentiment. Part of the stock’s longer-term climb can be linked to improving confidence in the banking sector and Citigroup’s ongoing restructuring efforts. However, the pullback this month suggests investors are reassessing the risk environment, perhaps in response to changing market dynamics or interest rate outlook, but not any sensational company-specific development.
Curious about value? Citigroup scores a 2 out of 6 on our valuation checklist, which means it looks undervalued on two key measures. But when it comes to making a decision, should you lean heavily on just a handful of metrics, or is there a smarter, more holistic way to approach valuation? Let’s break down the main methods investors use, before getting into what might be an even more powerful approach later on.
Citigroup scores just 2/6 on our valuation checks. See what other red flags we found in the full valuation breakdown.
The Excess Returns valuation model gauges whether a company is generating returns on its equity that exceed its cost of equity, which is an essential test of long-term value creation for shareholders. If the return on invested equity is higher than the hurdle rate (cost of equity), the business is building value on each new dollar invested.
For Citigroup, the model uses several forward-looking metrics provided by analysts. The current Book Value sits at $106.94 per share, with a projection of $118.51 per share in the stable state. Stable EPS is estimated at $9.80 per share, sourced from the weighted future Return on Equity estimates of 11 analysts. The long-term cost of equity is $9.72 per share, just a touch below anticipated EPS, indicating a slim but positive Excess Return of $0.07 per share. This is supported by an average Return on Equity forecast of 8.27%, comfortably above the estimated cost of capital.
Given these inputs, Citigroup's intrinsic value is estimated at $119.95 per share, about 19.9% above its recent share price. This suggests the stock is undervalued from an Excess Returns perspective, with its equity base having the potential to generate value in excess of its cost.
Result: UNDERVALUED
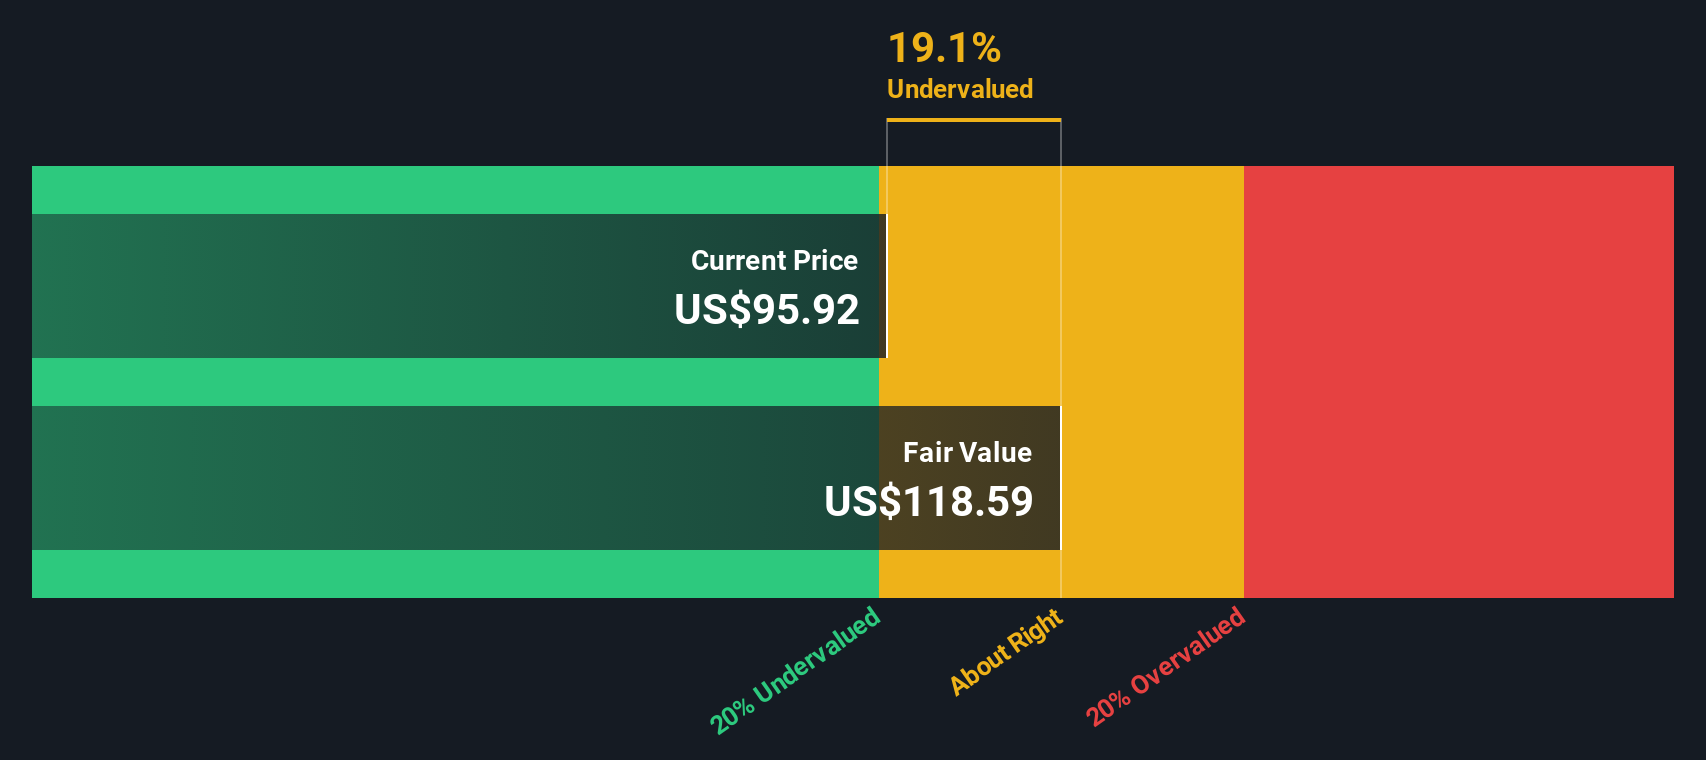
Our Excess Returns analysis suggests Citigroup is undervalued by 19.9%. Track this in your watchlist or portfolio, or discover more undervalued stocks.
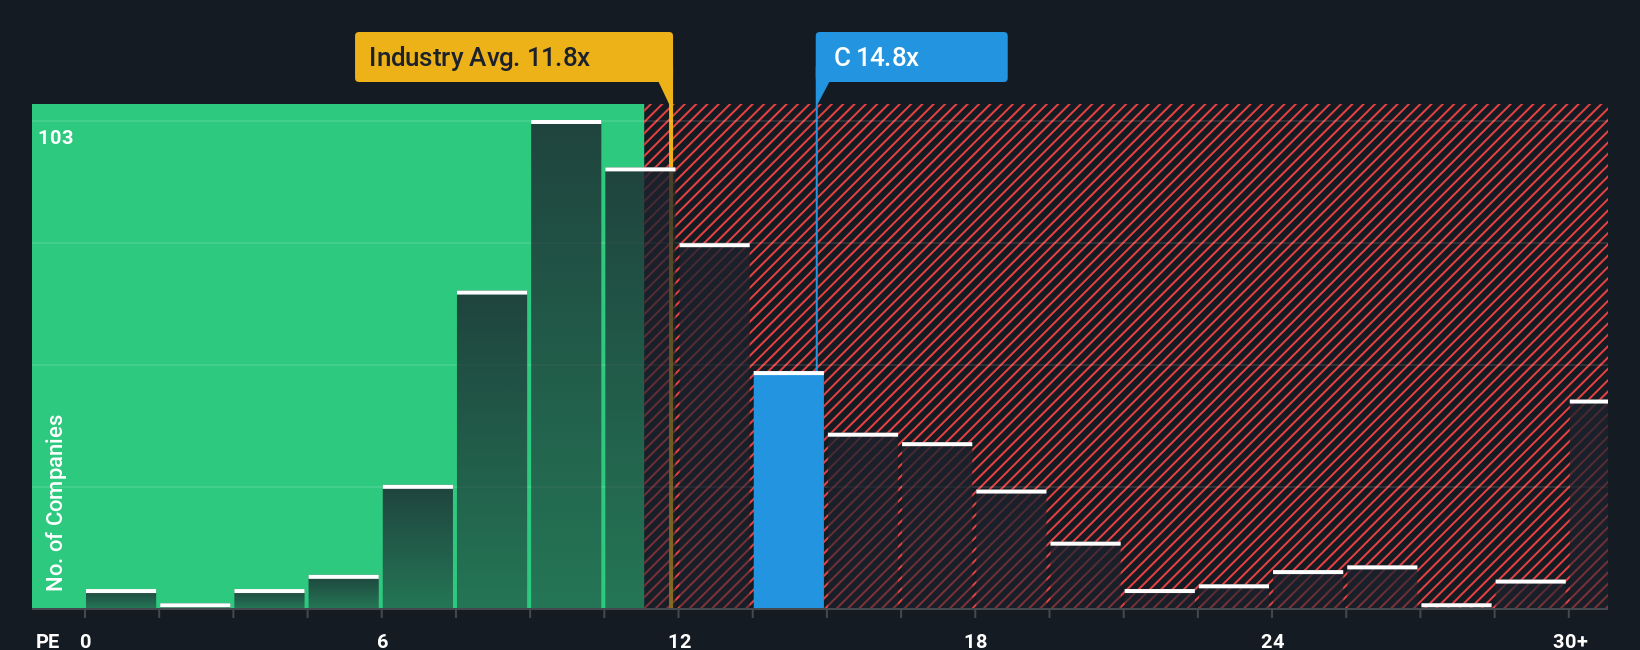
The price-to-earnings (PE) ratio is a reliable valuation yardstick for profitable companies such as Citigroup. It helps investors quickly gauge how much they are paying for each dollar of earnings, which is especially useful for banks whose profits tend to be relatively steady over time. Since the PE ratio incorporates the company’s earnings, it reflects both current profitability and investors’ growth expectations.
Growth outlook and the perceived riskiness of earnings help shape what a “normal” or “fair” PE ratio should be for a given company. Firms expected to grow faster or with more resilient profits typically warrant higher multiples, while increased uncertainty or industry pressures can keep valuations lower.
Citigroup currently trades at a PE of 13.71x. That is above the industry average for banks of 11.32x and also higher than its peer group average of 12.55x. On face value, this suggests the market expects Citigroup to outpace its rivals in some way, perhaps via growth or stronger returns.
But to get a truer sense of “fair value,” Simply Wall St’s proprietary Fair Ratio blends in important company specifics, such as Citigroup’s expected earnings growth, profit margins, size, and risk profile, along with broader industry context. This forward-thinking metric gives more clarity than simply benchmarking against peers, since it is tailored to Citigroup’s unique situation and outlook.
Citigroup’s Fair Ratio comes out to 17.50x. This is measurably higher than its actual multiple of 13.71x. That gap suggests Citigroup is noticeably undervalued based on its fundamentals and future prospects, not just compared to its sector.
Result: UNDERVALUED
PE ratios tell one story, but what if the real opportunity lies elsewhere? Discover companies where insiders are betting big on explosive growth.
Earlier we mentioned there is an even better way to understand valuation, so let’s introduce you to Narratives.
Narratives let you connect your story and perspective on a company to the financial numbers behind it, such as your own estimates for Citigroup’s fair value, expected revenue, future profits, and margins.
On Simply Wall St’s Community page, Narratives make it easy for anyone to build and share their view of what will drive Citigroup’s future, whether you are bullish about its digital leadership or cautious about risks in global banking.
Each Narrative links a company’s “story” to forecasts and outputs a Fair Value, so investors can see at a glance if the stock looks cheap, fair, or expensive versus today’s market price. This helps you decide when to buy or sell.
Best of all, Narratives update automatically as new data, news, or earnings come in, so your research keeps pace with the real world.
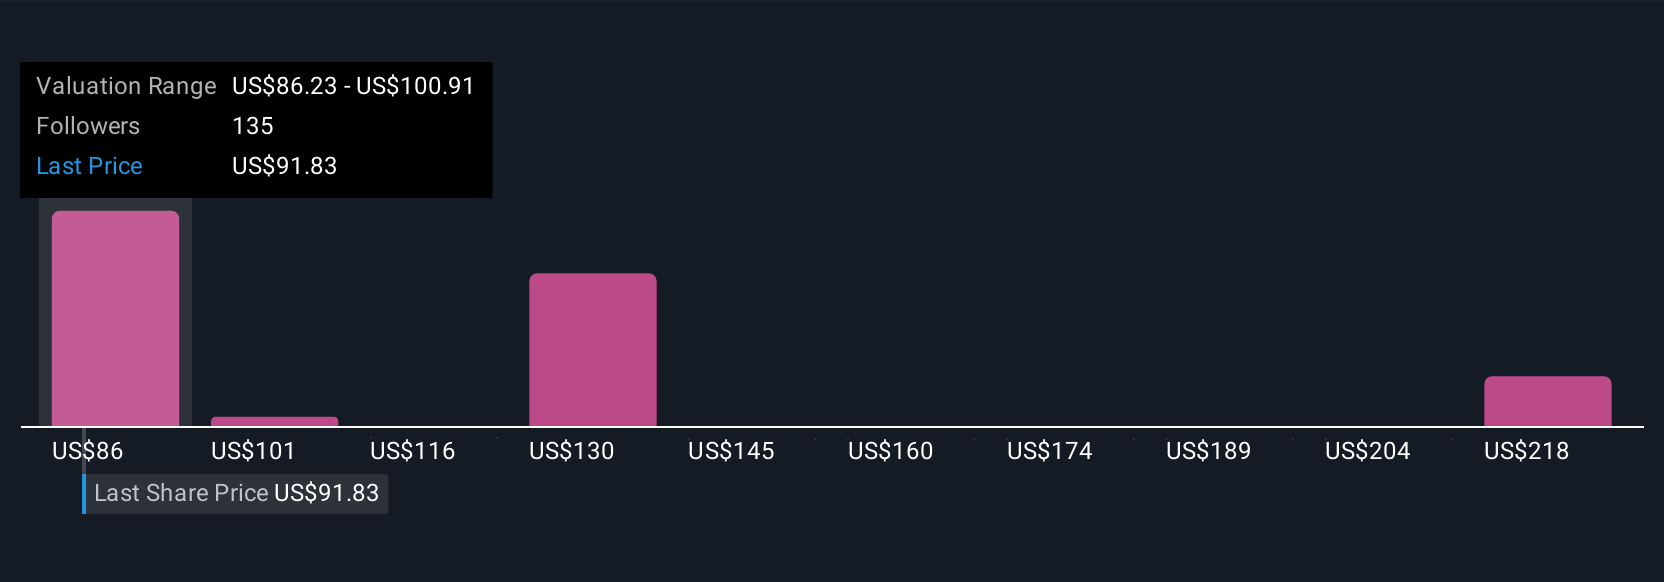
For example, some investors currently see Citigroup’s fair value over $230 per share by highlighting its leadership in digital assets, while others see fair value closer to $77 based on more cautious earnings forecasts. This demonstrates how different perspectives shape investment decisions.
Do you think there's more to the story for Citigroup? Create your own Narrative to let the Community know!
This article by Simply Wall St is general in nature. We provide commentary based on historical data and analyst forecasts only using an unbiased methodology and our articles are not intended to be financial advice. It does not constitute a recommendation to buy or sell any stock, and does not take account of your objectives, or your financial situation. We aim to bring you long-term focused analysis driven by fundamental data. Note that our analysis may not factor in the latest price-sensitive company announcements or qualitative material. Simply Wall St has no position in any stocks mentioned.
