
Please use a PC Browser to access Register-Tadawul
Get It
Does PDD Stock Present an Opportunity After Temu Resumes Shipping to US?
PINDUODUO INC. PDD | 111.96 111.96 | -0.01% 0.00% Pre |
If you have been eyeing PDD Holdings lately, you are far from alone. Deciding what to do with a stock like this can feel tricky, but there are a few things about PDD that should give you either confidence or at least something meaningful to consider while you make your decision. First off, the company has had its share of ups and downs recently, with the stock slipping a modest 0.5% over the past week but climbing 7.0% over the last month. Zoom out and you will spot that its year-to-date gain sits at a remarkable 38.1%, although it is still down 5.4% over the past twelve months. Over the longer term, PDD Holdings has been a serious outperformer, with shares up 139.1% over the past three years and 61.8% over five years.
Delving into what is driving this price action, there are clearly some catalysts worth noting. Temu, PDD's popular e-commerce platform, recently resumed shipping directly from China to U.S. consumers after a brief suspension. This move, combined with increased ad spending in the U.S., has brought fresh energy to the stock and helped shape market sentiment around its growth prospects and risk perception. If you want a sense of the optimism out there, just look at how three different analysts have boosted their price targets between $146 and $168, citing strong profits and performance in a tough environment.
But even with all this movement and noise, the real question usually comes down to valuation. Is PDD Holdings actually a bargain, or is the excitement already baked in? By the numbers, PDD earns a value score of 5 out of 6 on our checklist of undervaluation signals, a solid mark that definitely demands a closer look. In the next section, we are going to break down exactly how we arrive at that score and what traditional valuation methods say. And if you stick around to the end, you will see why valuation is about more than any score or checklist.
The Discounted Cash Flow (DCF) model is a classic valuation method that estimates a company's intrinsic value by projecting its future cash flows and discounting them back to today’s value. For PDD Holdings, this approach relies on extrapolating future Free Cash Flow (FCF) numbers based on both analyst forecasts and further projections provided by Simply Wall St.
PDD Holdings’ latest twelve months Free Cash Flow sits at approximately CN¥93.3 Billion, a sizable figure for any company in the Multiline Retail industry. Analyst estimates and further projections suggest this cash flow is expected to climb steadily. By 2035, the model anticipates annual FCF to reach around CN¥287.9 Billion. These projections take into account growth rates that taper from double-digit annual rates in the next few years to more conservative levels further out, reflecting both optimism and caution in long-term growth.
Using this two-stage Free Cash Flow to Equity model, the estimated intrinsic value of PDD shares stands at CN¥362.04 per share. This value implies the stock is trading at a 63.1% discount to its current price, making it substantially undervalued by this measure.
Result: UNDERVALUED
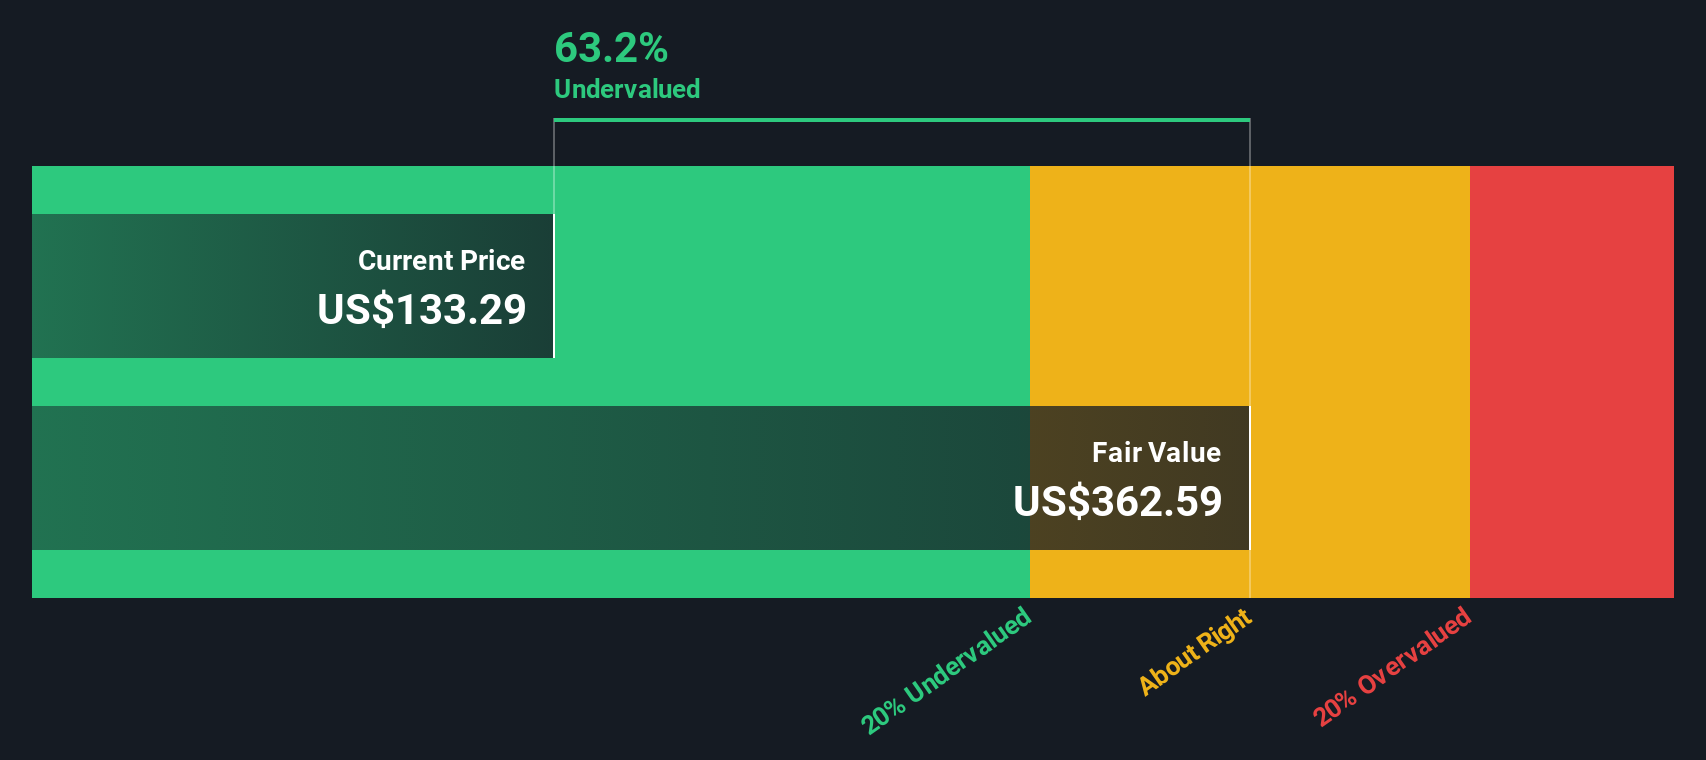
Our Discounted Cash Flow (DCF) analysis suggests PDD Holdings is undervalued by 63.1%. Track this in your watchlist or portfolio, or discover more undervalued stocks.
The Price-to-Earnings (PE) ratio is a widely used metric for valuing profitable companies because it gives investors a straightforward sense of how much they are paying for each dollar of current earnings. When a business is solidly profitable, as PDD Holdings is, the PE ratio is an especially useful tool for gauging whether its stock price reflects realistic expectations.
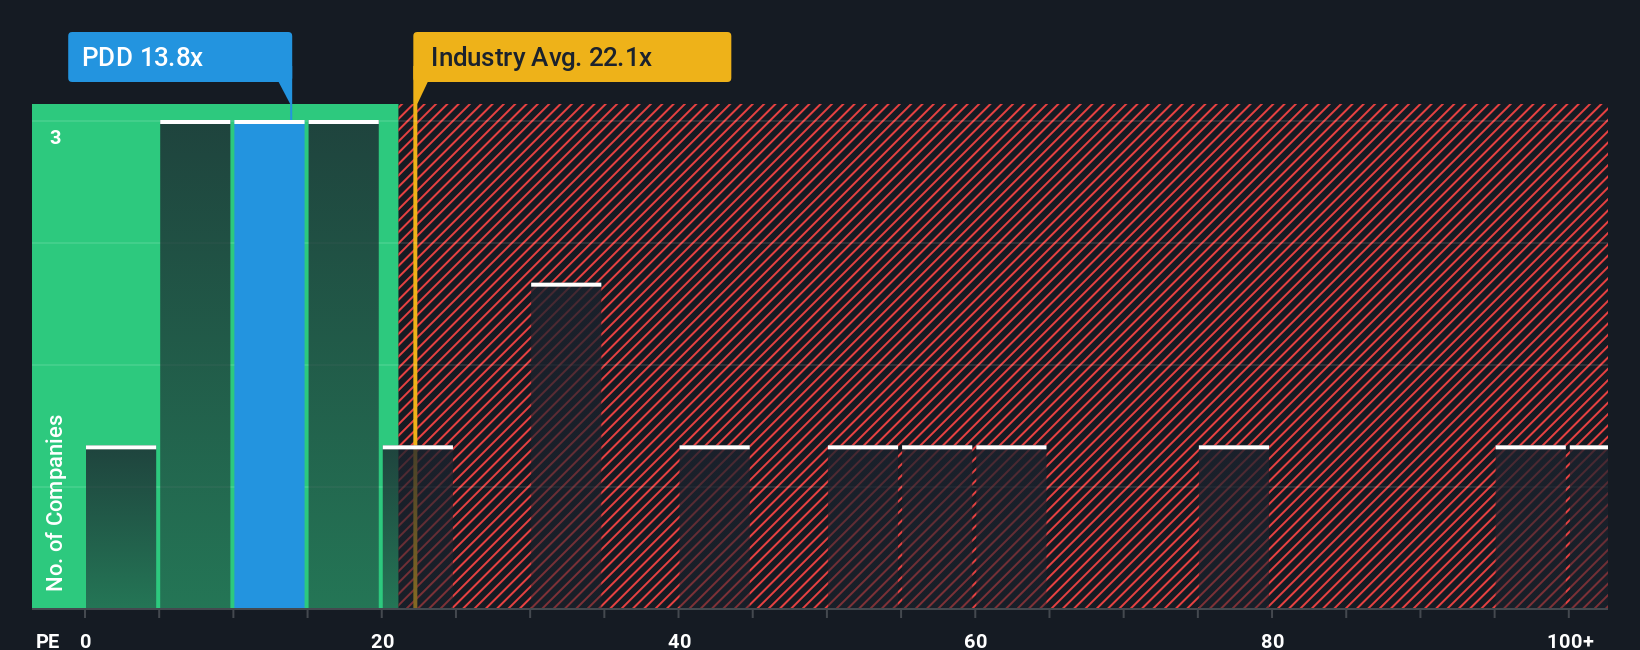
Determining what constitutes a “fair” PE multiple depends on factors like growth prospects and risk. Higher growth companies or those with more stable earnings usually warrant higher PE ratios, while stagnant or riskier firms tend to trade at a discount. In PDD Holdings’ case, its current PE ratio stands at 13.8x, which is significantly lower than the Multiline Retail industry average of 22.2x, and well beneath the peer average of 82.3x. This could suggest that the market is pricing in more conservative expectations or risks than for its competitors.
However, just comparing to industry averages has its limits. That is why Simply Wall St uses a “Fair Ratio” in this case, 28.6x, which accounts not just for industry or peer comparisons but also for PDD’s own earnings growth, market cap, profit margins, and risk profile. This more holistic approach avoids misleading signals that can come from looking at broad averages alone.
Since PDD Holdings’ actual PE ratio of 13.8x sits well below its Fair Ratio of 28.6x, the stock appears to be undervalued on an earnings multiple basis.
Result: UNDERVALUED
PE ratios tell one story, but what if the real opportunity lies elsewhere? Discover companies where insiders are betting big on explosive growth.
Earlier we mentioned that there is an even better way to understand valuation. Let us introduce you to Narratives. A Narrative is a concise story that brings together your perspective on a company's future, including your expectations for revenue, profit margins, and fair value, and connects these outlooks directly to a data-backed, transparent financial model.
Narratives move beyond static analyst estimates by allowing investors to articulate why they believe a stock is priced fairly or not, and to see how that story translates into specific fair value estimates. On Simply Wall St's Community page, investors can easily create or explore Narratives, a tool trusted by millions, to overlay their unique view of PDD Holdings’ future with live company data and models.
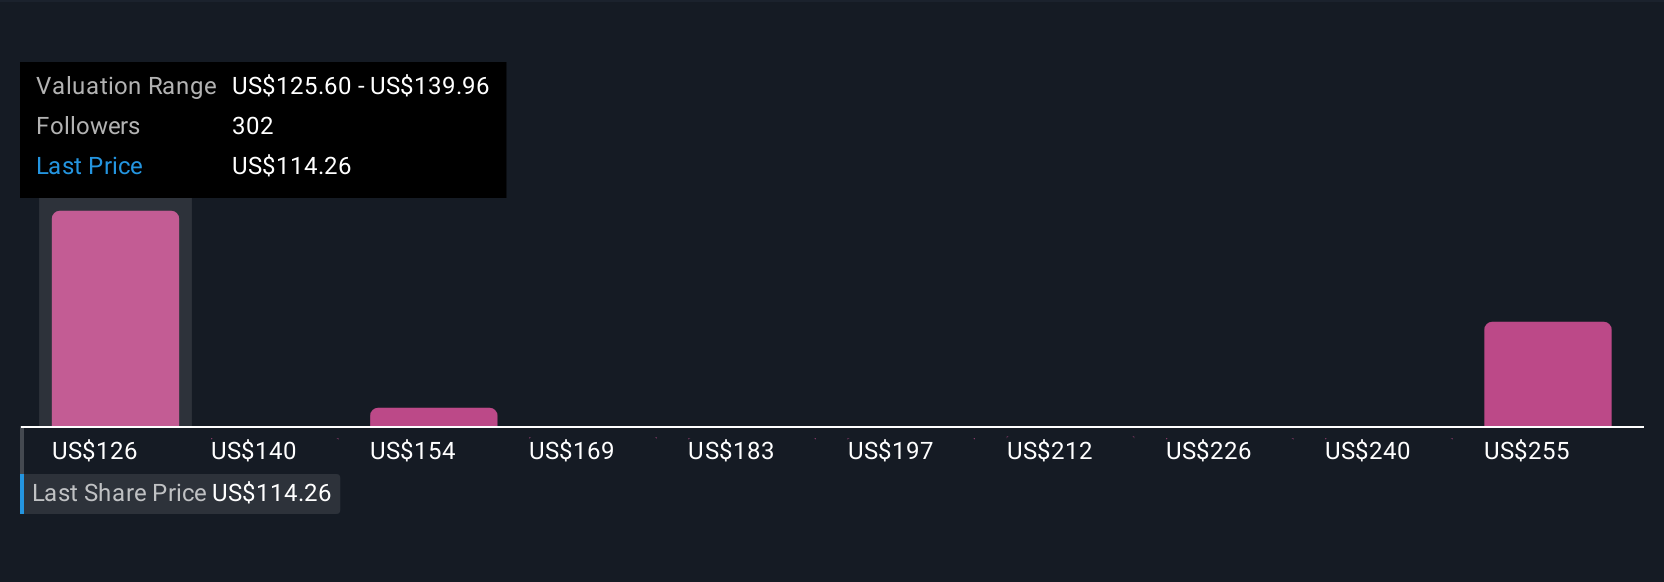
This makes it easy to compare your own or others’ Fair Value estimates with the current share price, keeping your decisions responsive, not reactive, as Narratives automatically update when new earnings or news is released. For example, some investors currently forecast a bullish price target for PDD Holdings of $176.36, while others set more cautious targets as low as $117.02. This illustrates how different future stories lead to different fair value conclusions.
Do you think there's more to the story for PDD Holdings? Create your own Narrative to let the Community know!
This article by Simply Wall St is general in nature. We provide commentary based on historical data and analyst forecasts only using an unbiased methodology and our articles are not intended to be financial advice. It does not constitute a recommendation to buy or sell any stock, and does not take account of your objectives, or your financial situation. We aim to bring you long-term focused analysis driven by fundamental data. Note that our analysis may not factor in the latest price-sensitive company announcements or qualitative material. Simply Wall St has no position in any stocks mentioned.
