Does The Recent Share Price Slump Make Iovance Biotherapeutics (IOVA) Look More Attractive?
Iovance Biotherapeutics Inc IOVA | 3.80 3.81 | -0.52% +0.28% Post |
- If you are trying to work out whether Iovance Biotherapeutics is a bargain or a value trap at its current share price, you will want a clear view of what the market is actually paying for its future prospects.
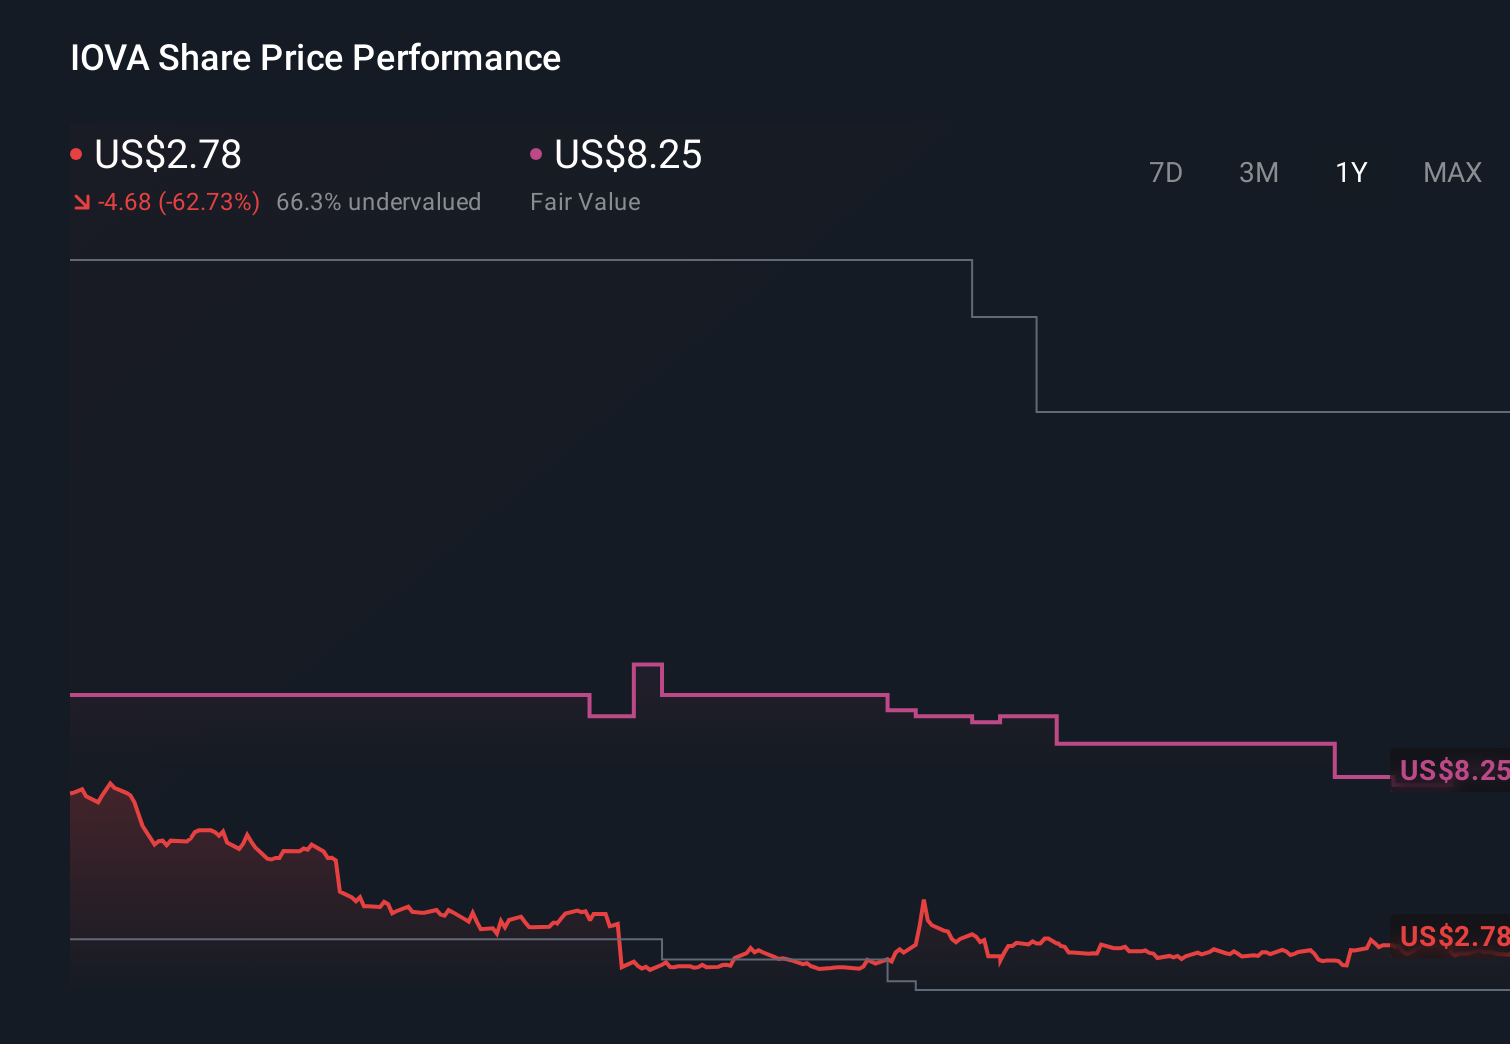
- The stock last closed at US$2.36 and has posted returns of a 10.3% decline over 7 days, 7.5% decline over 30 days, 6.3% decline year to date, 59.9% decline over 1 year, 68.2% decline over 3 years and 95.1% decline over 5 years, which will influence how investors think about its risk and potential reward today.
- Recent news flow around Iovance Biotherapeutics has focused on its position in the pharmaceuticals and biotech space, including ongoing interest in its cell therapy pipeline and regulatory progress for its treatments. This context helps explain why the market is closely watching any updates that could shift confidence in the company and its long term prospects.
- On Simply Wall St's valuation checks, Iovance Biotherapeutics scores 5 out of 6, which suggests the stock screens as undervalued on most of the key measures considered there. Next, the main valuation approaches used to assess the company will be outlined, followed by a more rounded way to think about what the current price really implies.
Approach 1: Iovance Biotherapeutics Discounted Cash Flow (DCF) Analysis
A Discounted Cash Flow, or DCF, model looks at the cash Iovance Biotherapeutics is expected to generate in the future, then discounts those cash flows back to today to estimate what the business might be worth right now.
For Iovance Biotherapeutics, the model used is a 2 Stage Free Cash Flow to Equity approach based on cash flow projections. The latest twelve month free cash flow stands at a loss of $367.7 million. Analyst and extrapolated estimates show projected free cash flow moving to $386 million by 2030, with a path that runs through figures such as $102 million in 2026, $212 million in 2028 and $626.9 million in 2035, all in dollar terms and before discounting.
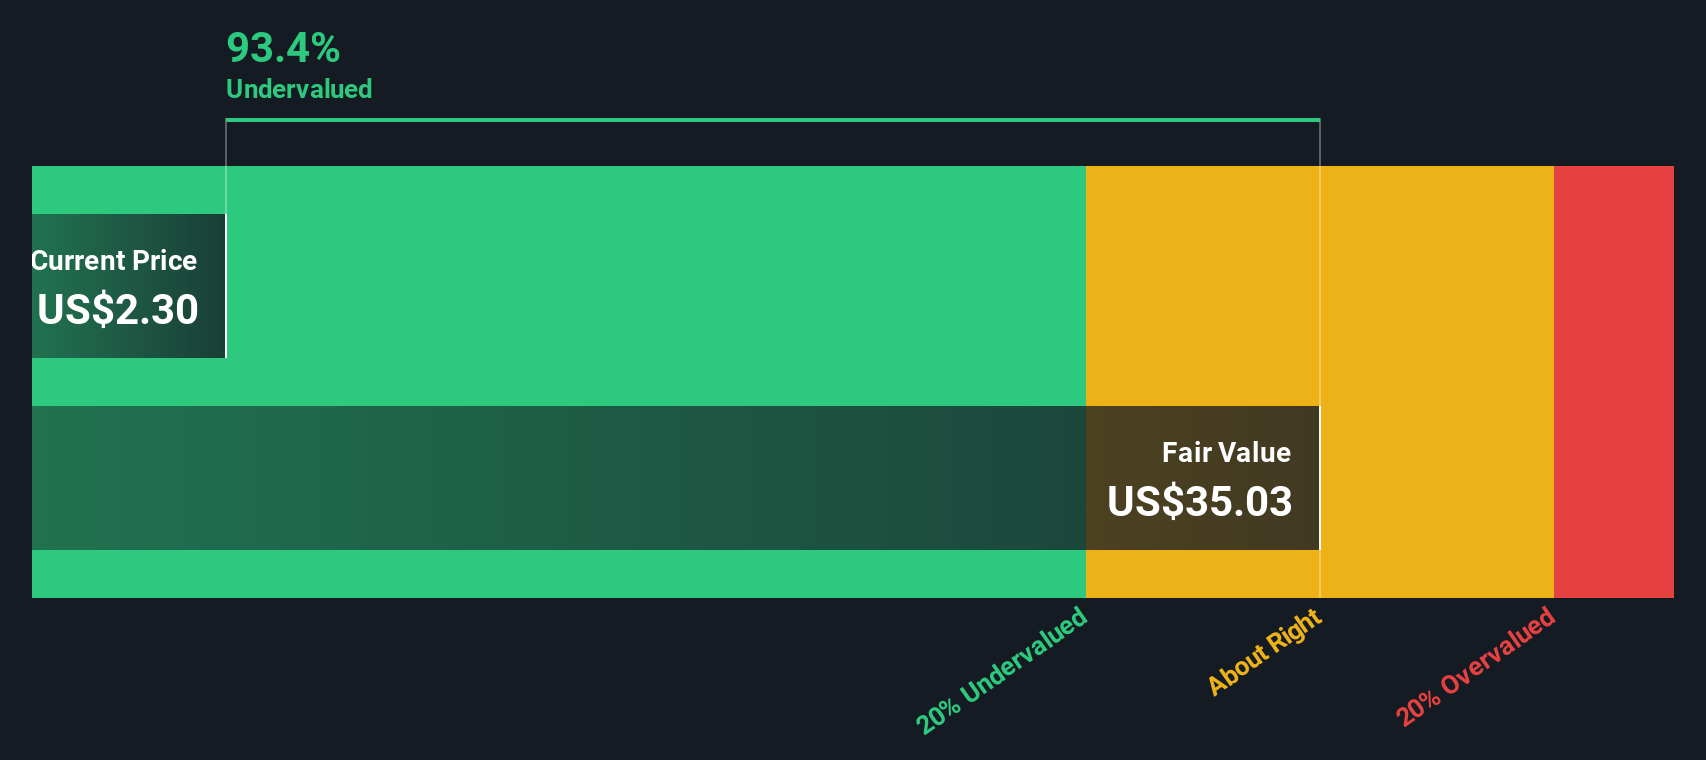
After discounting these projected cash flows, the DCF model from Simply Wall St arrives at an estimated intrinsic value of US$27.19 per share. Compared to the recent share price of US$2.36, this output suggests the stock is 91.3% undervalued under the model’s assumptions.
Result: UNDERVALUED
Our Discounted Cash Flow (DCF) analysis suggests Iovance Biotherapeutics is undervalued by 91.3%. Track this in your watchlist or portfolio, or discover 55 more high quality undervalued stocks.
Approach 2: Iovance Biotherapeutics Price vs Sales
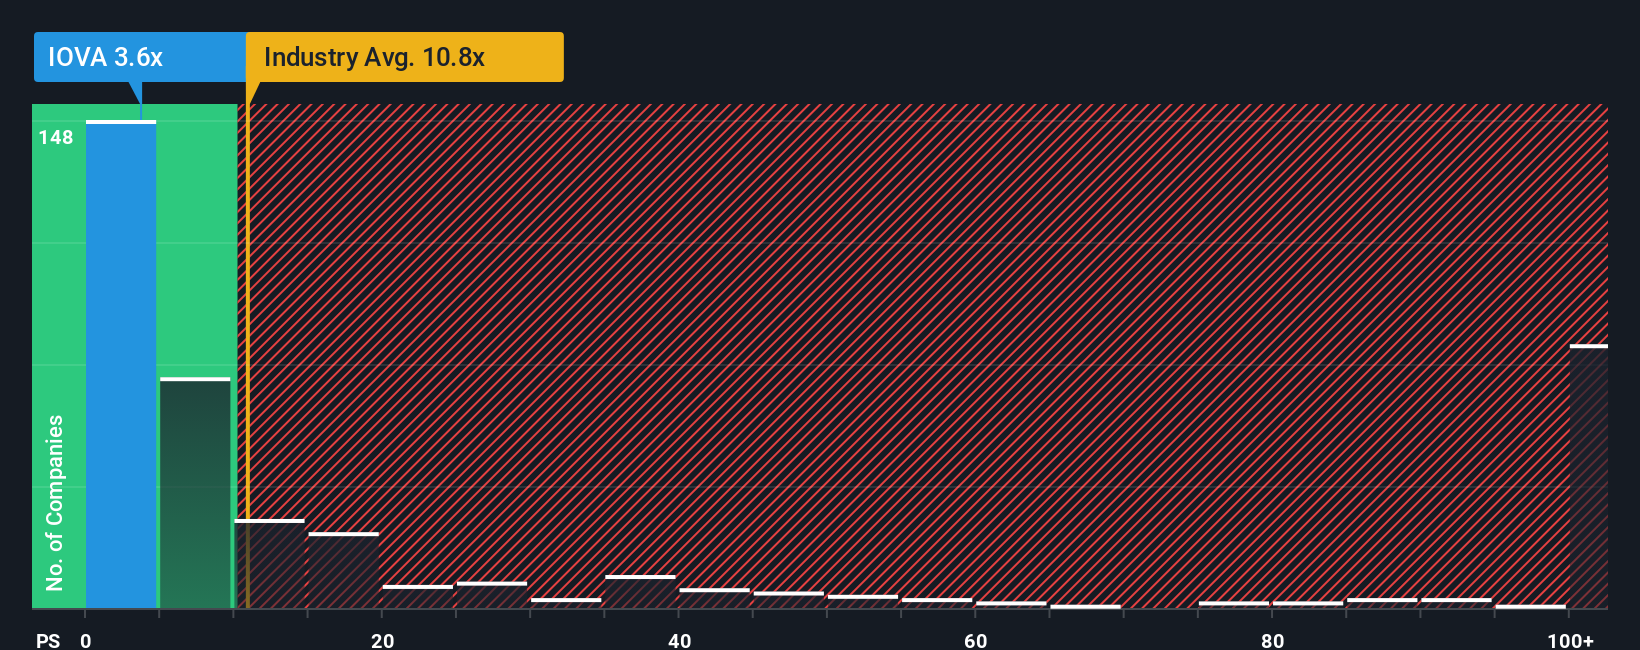
For companies that are not yet profitable, P/S is often more useful than P/E because it focuses on revenue rather than earnings, which can be heavily affected by research and development spending and other early stage costs.
What investors are really weighing up is how much they are prepared to pay for each dollar of sales, given the company’s prospects and the risks involved. Higher growth expectations or lower perceived risk can justify a higher P/S multiple. In contrast, lower growth or higher risk usually point to a lower, more conservative range.
Iovance Biotherapeutics currently trades on a P/S of 3.74x. This sits below the Biotechs industry average P/S of 10.91x and also below the peer group average of 6.50x. Simply Wall St’s Fair Ratio for the stock is 4.02x, which is their proprietary view of what the P/S multiple could be, given factors such as growth profile, industry, profit margins, market cap and specific risks.
This Fair Ratio can be more informative than a simple comparison with peers or the broad industry because it adjusts for company specific traits rather than assuming all biotechs deserve the same multiple. With the current P/S at 3.74x compared with a Fair Ratio of 4.02x, the shares screen as undervalued on this measure.
Result: UNDERVALUED
P/S ratios tell one story, but what if the real opportunity lies elsewhere? Start investing in legacies, not executives. Discover our 22 top founder-led companies.
Upgrade Your Decision Making: Choose your Iovance Biotherapeutics Narrative
Earlier we mentioned that there is an even better way to understand valuation, so let us introduce you to Narratives, which are simply your story about a company linked directly to your own numbers for fair value, future revenue, earnings and margins.
A Narrative connects what you believe about Iovance Biotherapeutics, such as its cell therapy opportunity or regulatory risks, to a financial forecast and then to a fair value that you can compare with the current share price.
On Simply Wall St, Narratives sit inside the Community page and are designed to be easy to use. They help you quickly see whether your view points to the stock trading above or below your Fair Value and therefore whether you might prefer to wait, add, or reduce exposure.
Narratives are also refreshed when new information like earnings or major news is added to the platform, so your fair value view stays aligned with the latest data. For example, one investor might set a very optimistic Narrative for Iovance Biotherapeutics with a high fair value, while another might use much more cautious assumptions and arrive at a far lower figure.
Do you think there's more to the story for Iovance Biotherapeutics? Head over to our Community to see what others are saying!
This article by Simply Wall St is general in nature. We provide commentary based on historical data and analyst forecasts only using an unbiased methodology and our articles are not intended to be financial advice. It does not constitute a recommendation to buy or sell any stock, and does not take account of your objectives, or your financial situation. We aim to bring you long-term focused analysis driven by fundamental data. Note that our analysis may not factor in the latest price-sensitive company announcements or qualitative material. Simply Wall St has no position in any stocks mentioned.