
Please use a PC Browser to access Register-Tadawul
Get It
Evaluating Berkshire Hathaway (BRK.A): Is There Value Left for Investors?
Berkshire Hathaway Inc. Class A BRK.A | 756120.01 756120.01 | +0.93% 0.00% Pre |
Berkshire Hathaway (BRK.A) stock has seen some movement lately, reflecting evolving market sentiment. Many investors are curious about how the company’s current performance lines up with its longer-term track record and overall financial health.
Berkshire Hathaway’s share price has shown modest momentum over the year, with a 0.1% year-to-date share price return and a 0.1% total shareholder return across the past twelve months. This is a steady result considering broader market volatility and recent headlines about shifts in its portfolio. Over longer periods, performance remains strong and is highlighted by a 1.3% total shareholder return over five years, which reflects Berkshire’s consistent compounding and resilience even as sentiment around conglomerates evolves.
If you’re curious how other companies with strong growth and insider alignment are performing, now’s a great time to discover fast growing stocks with high insider ownership
With returns stabilizing and analysts citing a modest discount to fair value, investors are left to consider whether Berkshire Hathaway is undervalued at today’s levels or if future gains are already fully reflected in the price.
Berkshire Hathaway trades at a price-to-earnings (P/E) ratio of 17x, which is beneath its estimated fair P/E of 19.8x and the peer average of 28x. This signals the market may not be fully pricing in its underlying profitability. The last close price was $744,627.72 per share.
The price-to-earnings ratio captures what investors are willing to pay for each dollar of the company’s current earnings. For Berkshire Hathaway, which has a mature diversified portfolio and a resilient earnings profile, this multiple highlights how the market is weighing its steady, long-term cash generation against overall sector trends.
Compared to the broader US diversified financials industry average of 16.5x, Berkshire’s P/E is only modestly higher; however, it remains well below both its own fair P/E and that of peers. This indicates there could be room for the market to adjust if Berkshire demonstrates renewed earnings growth or if the narrative around conglomerate discounts changes.
Result: Price-to-Earnings of 17x (UNDERVALUED)
However, continued net income declines or broader market volatility could challenge the current value case and shift investor sentiment in the months ahead.
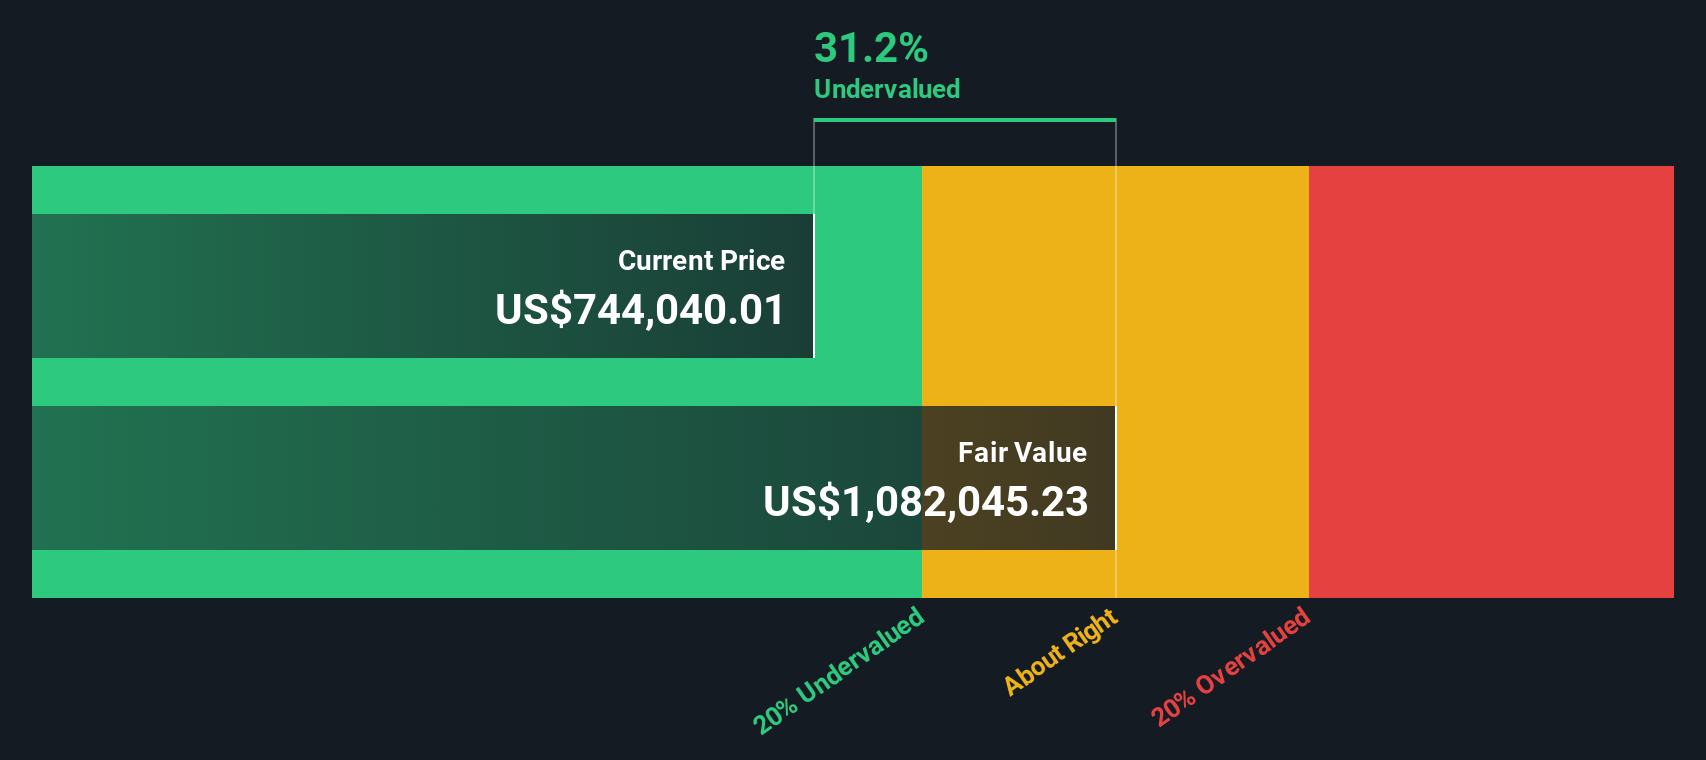
Looking at Berkshire Hathaway using our DCF model, the picture appears quite different. The DCF analysis suggests the stock is trading about 31% below its estimated fair value. This signals that, beyond earnings multiples, there could be significant upside the market might be overlooking. Which view will the market trust in the long run?
Simply Wall St performs a discounted cash flow (DCF) on every stock in the world every day (check out Berkshire Hathaway for example). We show the entire calculation in full. You can track the result in your watchlist or portfolio and be alerted when this changes, or use our stock screener to discover undervalued stocks based on their cash flows. If you save a screener we even alert you when new companies match - so you never miss a potential opportunity.
If you have a different perspective or would rather dive into the numbers yourself, it’s easy to shape your own analysis in just a few minutes with Do it your way.
A great starting point for your Berkshire Hathaway research is our analysis highlighting 1 key reward and 1 important warning sign that could impact your investment decision.
Act fast and give yourself an edge by searching beyond the obvious. The next breakout winner could be hiding in plain sight if you know where to look.
This article by Simply Wall St is general in nature. We provide commentary based on historical data and analyst forecasts only using an unbiased methodology and our articles are not intended to be financial advice. It does not constitute a recommendation to buy or sell any stock, and does not take account of your objectives, or your financial situation. We aim to bring you long-term focused analysis driven by fundamental data. Note that our analysis may not factor in the latest price-sensitive company announcements or qualitative material. Simply Wall St has no position in any stocks mentioned.
