Evaluating Workiva (WK) After Recent Share Weakness And A 29.7% Undervaluation Signal
Workiva Inc. Class A WK | 59.77 59.77 | -0.38% 0.00% Pre |
Workiva stock: event-driven snapshot
Workiva (WK) has drawn investor attention after a period of weaker share performance, with the stock down about 12% over the past month and roughly 23% over the past year.
The recent 1 day share price return of 6.18% decline, together with a 30 day share price return of 11.6% decline and a 1 year total shareholder return of 23% loss, suggests momentum has been fading as investors reassess growth prospects and risk.
If you are comparing Workiva with other software names, this could be a good moment to see what else is moving across tech and AI by screening for high growth tech and AI stocks.
So with Workiva trading at a discount to some analyst targets and an indicated intrinsic discount, yet still posting revenue growth alongside a net loss, are you looking at an undervalued growth story or a stock where future gains are already priced in?
Most Popular Narrative: 29.7% Undervalued
With Workiva last closing at $76.27 against a narrative fair value of about $108.45, the current setup leans heavily on future execution and earnings power.
The analysts are assuming Workiva's revenue will grow by 20.6% annually over the next 3 years. Analysts assume that profit margins will increase from 8.3% loss today to 2.7% profit in 3 years time.
Want to see what turns today’s loss into future profit in this narrative? Revenue gains, margin shifts and a rich earnings multiple all have roles to play.
Result: Fair Value of $108.45 (UNDERVALUED)
However, you still need to weigh the chance that changing regulations or weaker partner execution on deployments could hit growth and margins harder than this narrative assumes.
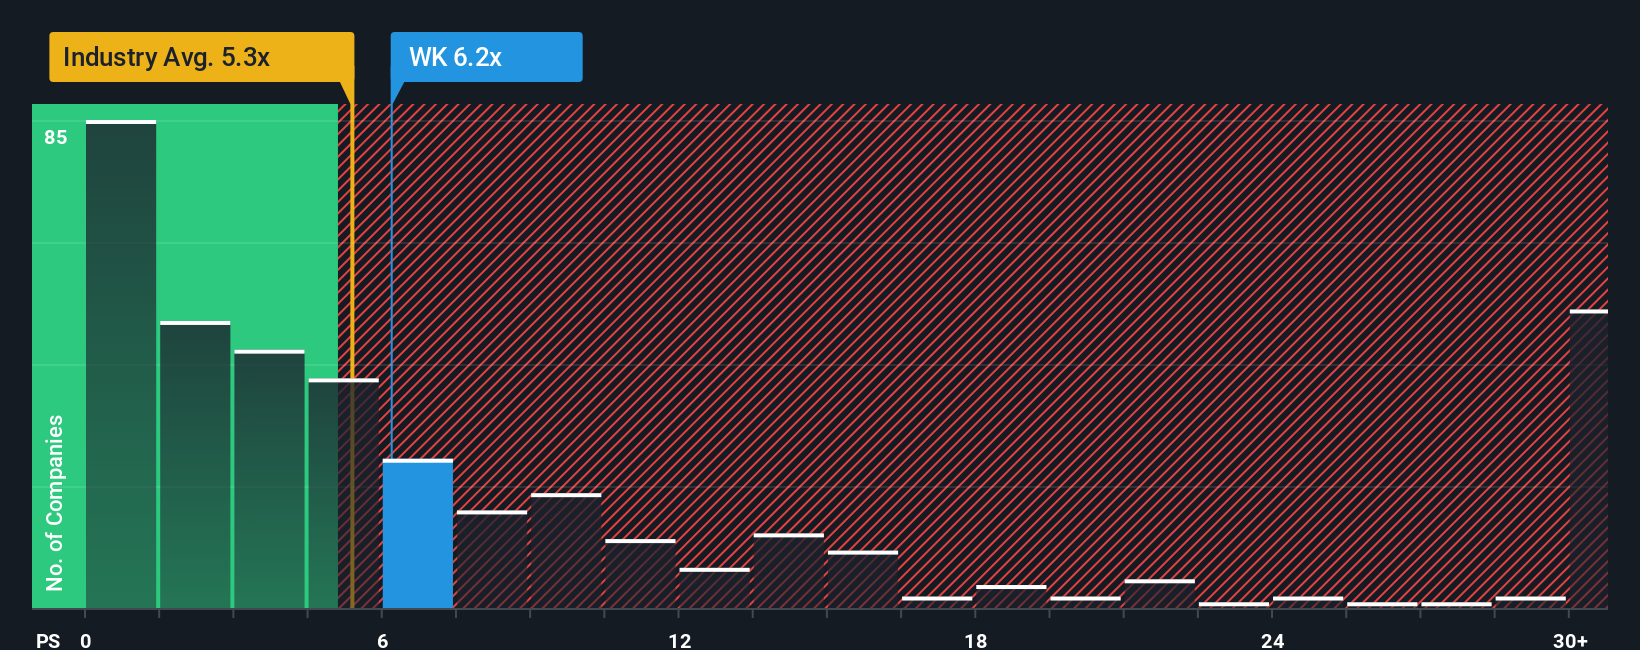
Another Angle: What The P/S Ratio Is Saying
While the narrative and fair value work suggest upside, the current P/S of 5.1x paints a different picture. It sits above the US Software industry at 4.5x and above peers at 3.5x, yet it remains below a fair ratio estimate of 5.9x. Is that extra premium a source of comfort or a cause for concern for you?
Build Your Own Workiva Narrative
If you look at this and think the story should read differently, or you simply want to test your own view against the data, you can build a custom thesis in just a few minutes with Do it your way.
A great starting point for your Workiva research is our analysis highlighting 3 key rewards and 2 important warning signs that could impact your investment decision.
Ready for more investment ideas?
If you stop with just one company, you could miss opportunities that better fit your goals, so widen your view and pressure test your thinking with curated stock ideas.
- Spot potential bargains by comparing valuation and fundamentals across these 865 undervalued stocks based on cash flows that might match the kind of pricing setup you are looking for.
- Target future focused themes by scanning these 24 quantum computing stocks where advanced computing could play a growing role in tomorrow's tech stack.
- Strengthen your income watchlist by filtering for these 14 dividend stocks with yields > 3% that line up with your preferences on yield and stability.
This article by Simply Wall St is general in nature. We provide commentary based on historical data and analyst forecasts only using an unbiased methodology and our articles are not intended to be financial advice. It does not constitute a recommendation to buy or sell any stock, and does not take account of your objectives, or your financial situation. We aim to bring you long-term focused analysis driven by fundamental data. Note that our analysis may not factor in the latest price-sensitive company announcements or qualitative material. Simply Wall St has no position in any stocks mentioned.