Evaluating Xylem After 21% Surge and New EPA Water Infrastructure Grants
Xylem Inc. XYL | 121.26 | -1.00% |
If you are weighing what to do with Xylem stock, you are not alone. Lately, onlookers have been trying to gauge what's driving XYL's complex moves in the market. After a choppy spring, Xylem’s share price has notched up an impressive 21% gain year-to-date, and even over the last three years, the stock has delivered nearly a 49% total return. Those numbers are hard to ignore, especially if you are on the hunt for companies with a mix of steady growth and potential upside.
So, what is fueling these moves? Over the past quarter, Xylem has benefitted from improved sentiment around water infrastructure stocks, spurred by government investment in the sector and an uptick in revenue and net income growth. Recent earnings show annual revenue growth at just over 5% and net income climbing more than 13%, indicating the company’s operational momentum is translating into investor confidence. Last month’s performance was notably positive, with the stock up almost 7%. Momentum over the past five years is even stronger, with XYL’s total return clocking in at 83% for that longer stretch.
Despite this strong track record, a look at common valuation checks paints a mixed picture: Xylem earns a value score of just 1 out of 6, suggesting it appears undervalued by only one standard metric. It is a reminder that recent price growth may have made shares look less like a bargain, depending on which angle you assess it from.
Next, let’s break down the most widely used valuation approaches for Xylem and see where the numbers leave us. Stay tuned for an even deeper take on what really matters when assessing valuation.
Xylem delivered 4.8% returns over the last year. See how this stacks up to the rest of the Machinery industry.Approach 1: Xylem Cash Flows
The Discounted Cash Flow (DCF) model estimates a company’s intrinsic value by projecting its future free cash flows and then discounting those projections back to today. This approach gives investors a sense of what the stock might be worth based on underlying cash generation, instead of relying solely on market sentiment.
For Xylem, the most recent Free Cash Flow (FCF) is approximately $881 million, with analysts forecasting solid annual growth. Looking ahead, free cash flows are projected to rise to about $2.35 billion by 2035, reflecting expectations for steady operational momentum through the next decade.
Based on these forecasts, the DCF model assigns Xylem an intrinsic value of $140.99 per share. When compared with the current share price, this valuation indicates the stock is only about 0.5% undervalued, suggesting the market’s pricing is almost in line with intrinsic value.
Result: ABOUT RIGHT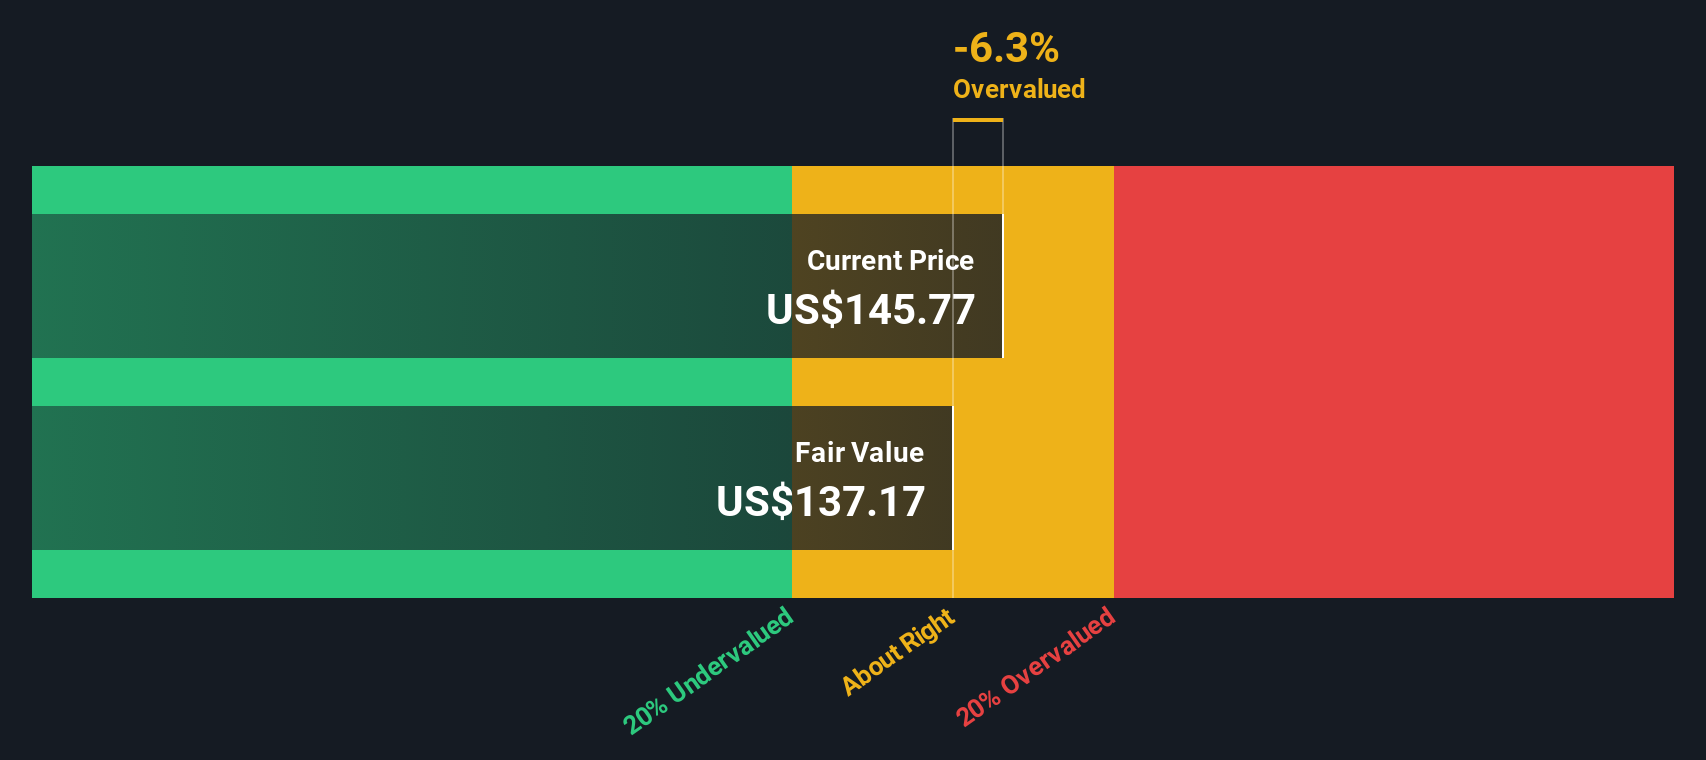
Approach 2: Xylem Price vs Earnings
For profitable companies like Xylem, the Price-to-Earnings (PE) ratio is a widely accepted way to gauge valuation because it links a company’s market price directly to its earnings power. This makes it easier for investors to benchmark performance and value against both the industry and similar peers. Importantly, a company’s growth outlook and perceived risks play a major role in what is considered a “normal” or “fair” PE multiple. Generally, higher growth can justify premium valuations, while higher risk may lead to a discount.
Currently, Xylem trades at a PE of 36.39x, which is notably above both the machinery industry average of 23.67x and the peer group average of 30.28x. At first glance, this higher multiple could suggest that shares are potentially overvalued relative to the broader market and its competitors. However, Simply Wall St’s proprietary Fair Ratio (which factors in elements like future earnings growth, profitability, market cap, and risk) comes out to 27.27x for Xylem. This Fair Ratio provides a more tailored benchmark specifically for Xylem’s profile.
Given that Xylem’s actual PE ratio is well above its Fair Ratio, the shares appear to be trading at a premium based on expected fundamentals, which signals possible overvaluation at current levels.
Result: OVERVALUED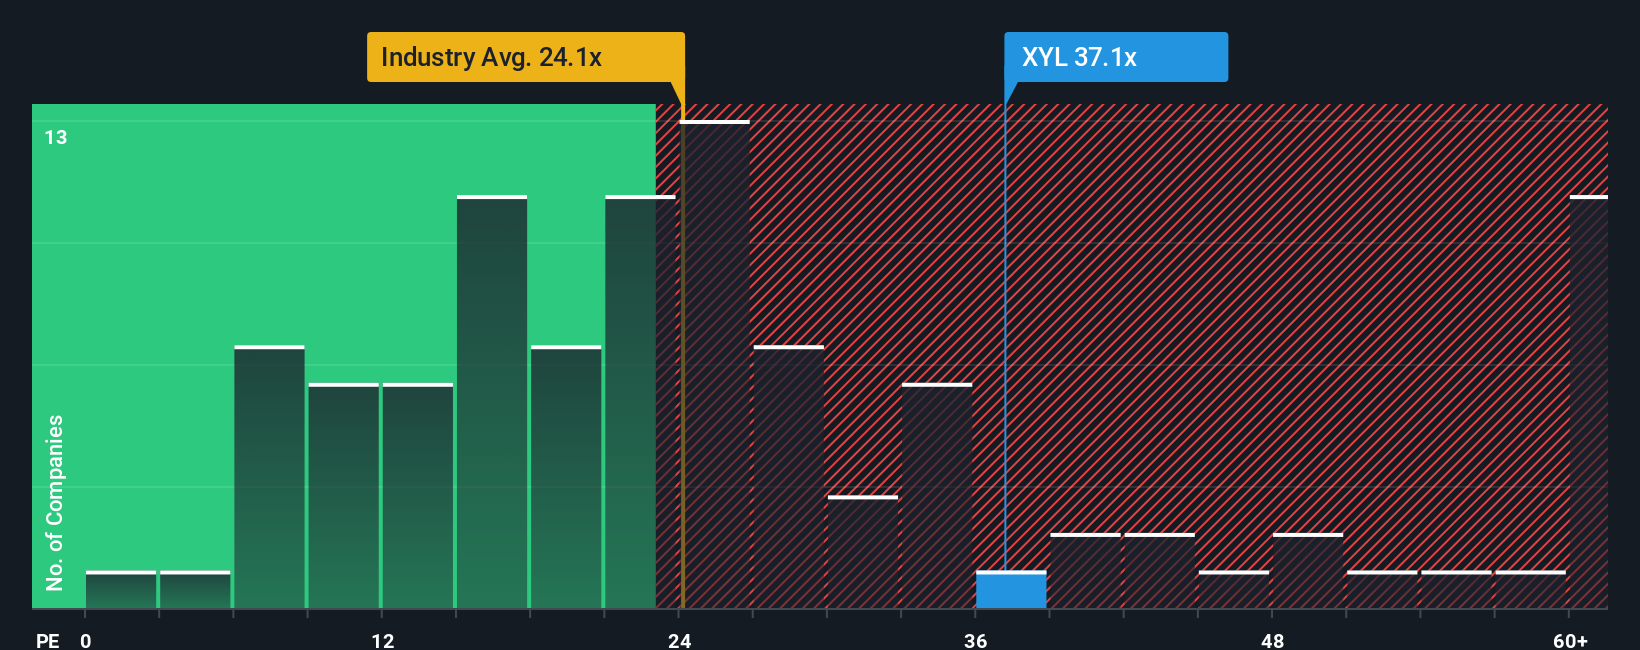
Upgrade Your Decision Making: Choose your Xylem Narrative
While traditional models like PE and DCF focus strictly on numbers, Narratives offer a more powerful, user-friendly way to make investment decisions by connecting a company’s real-world story with a financial forecast and resulting fair value.
A Narrative is essentially your perspective on the company, what you believe about its business drivers, future prospects, and risks, translated into concrete revenue, earnings, and margin estimates that map directly to a fair share price.
On the Simply Wall St platform, Narratives make it simple for both newcomers and seasoned investors to craft and compare these story-driven valuations in real time, drawing on insights from millions of community members.
By reviewing Narratives, you can see different fair values for Xylem. The most bullish sees potential as high as $175, while the most cautious pegs fair value at $125. This helps inform whether it makes sense to buy or sell as the current price changes.
As new information and earnings are released, Narratives remain dynamic and update automatically, so your decision-making can always reflect the latest outlook.
Do you think there's more to the story for Xylem? Create your own Narrative to let the Community know!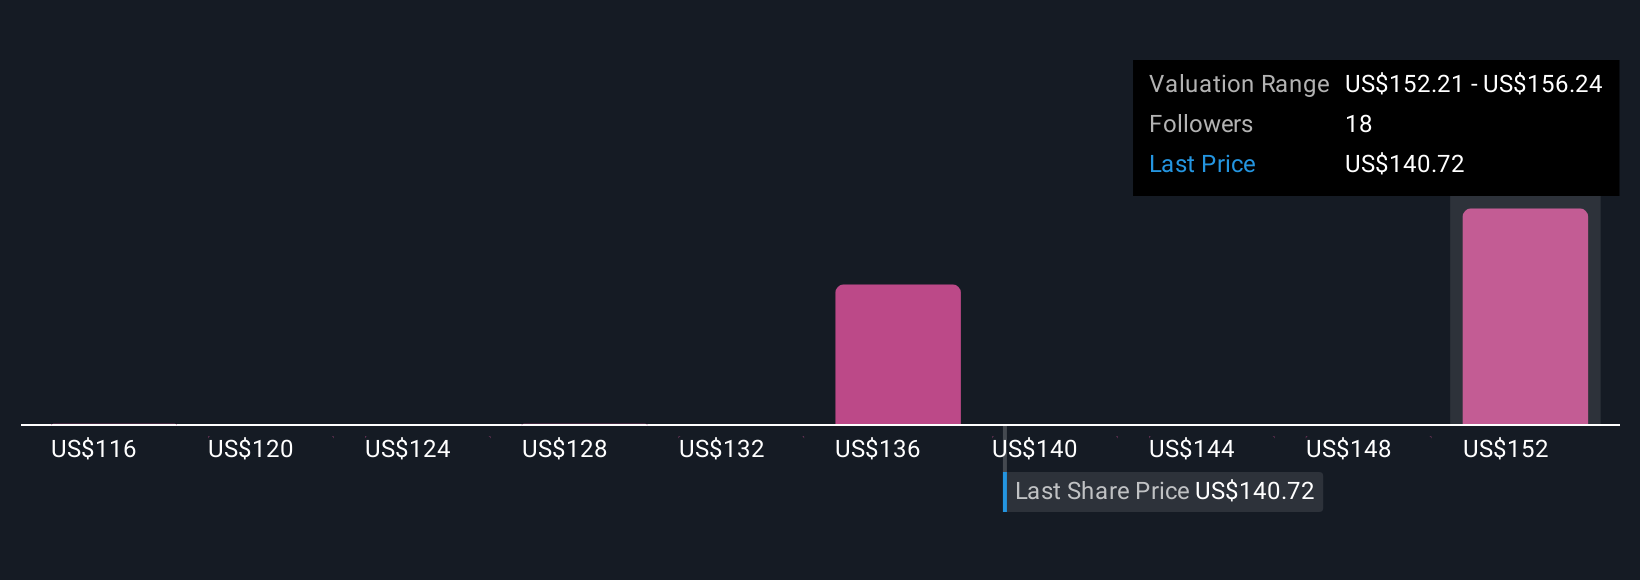
This article by Simply Wall St is general in nature. We provide commentary based on historical data and analyst forecasts only using an unbiased methodology and our articles are not intended to be financial advice. It does not constitute a recommendation to buy or sell any stock, and does not take account of your objectives, or your financial situation. We aim to bring you long-term focused analysis driven by fundamental data. Note that our analysis may not factor in the latest price-sensitive company announcements or qualitative material. Simply Wall St has no position in any stocks mentioned.