Farmers & Merchants Bancorp (FMAO) Net Interest Margin Expansion Reinforces Bullish Narratives
Farmers & Merchants Bancorp, Inc. FMAO | 25.62 25.62 | -1.00% 0.00% Pre |
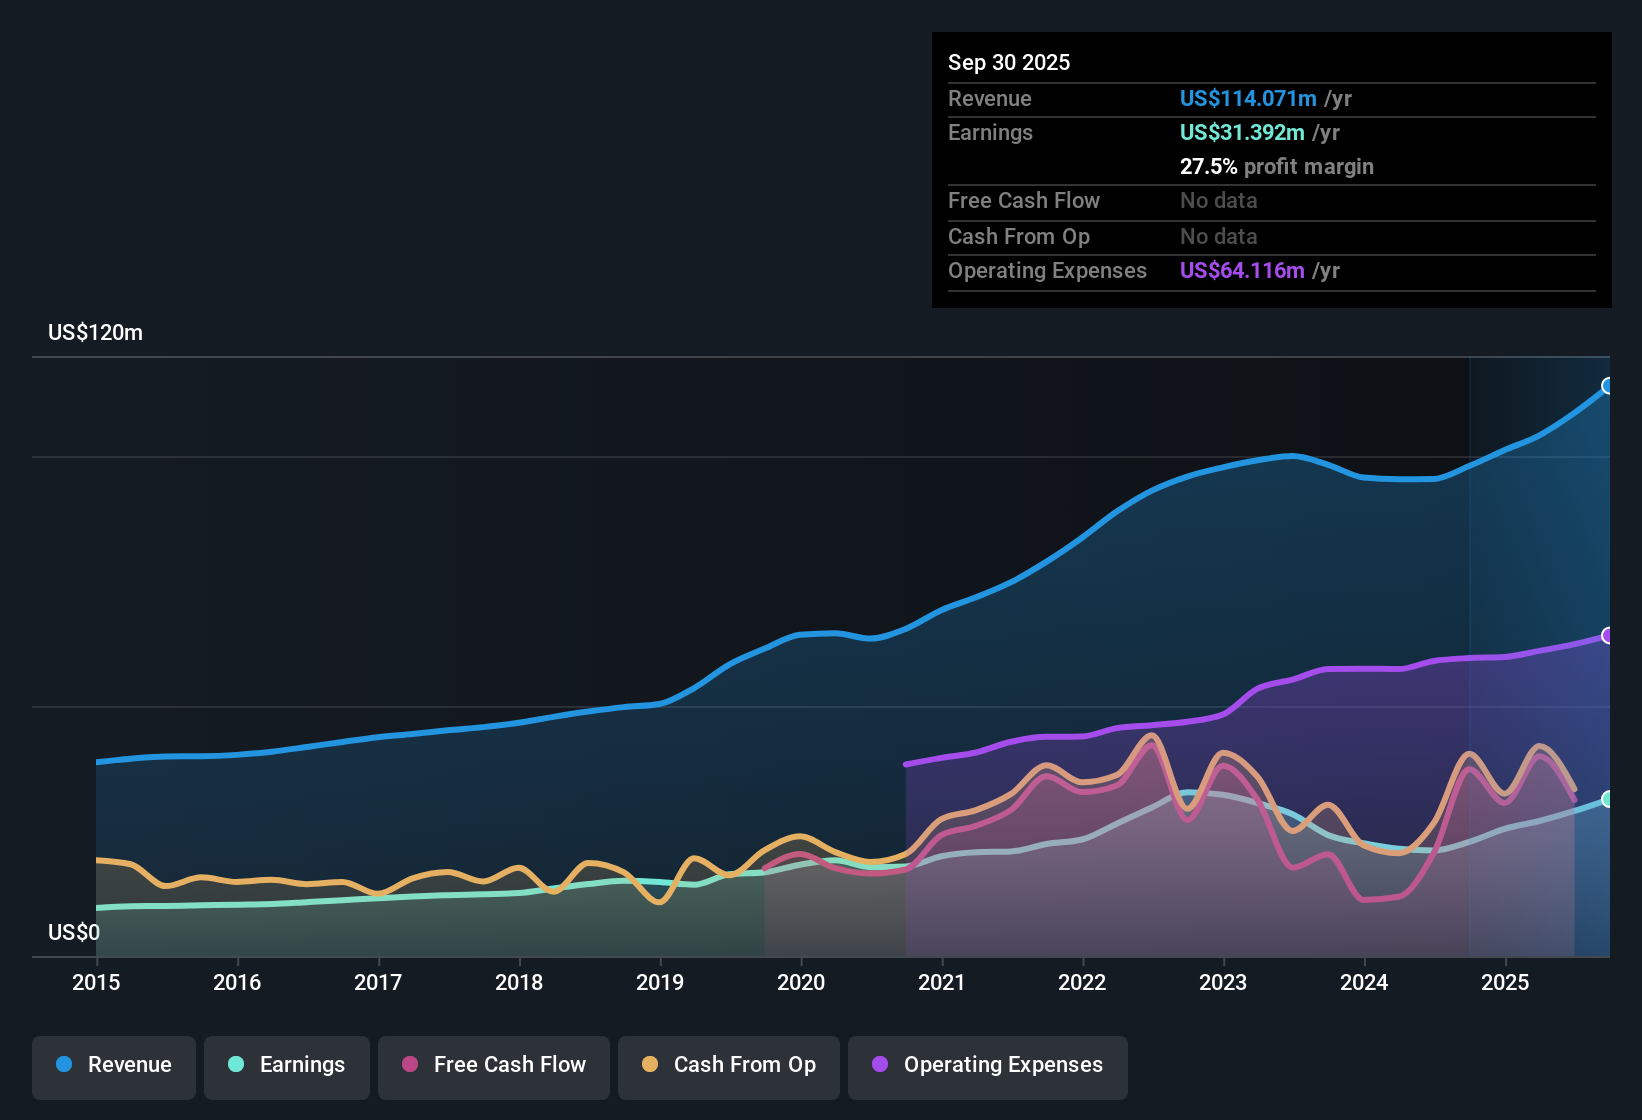
Farmers & Merchants Bancorp (FMAO) has wrapped up FY 2025 with fourth quarter revenue of US$31.9 million and EPS of US$0.71, capping off a trailing twelve month run of US$119.4 million in revenue and EPS of US$2.39 alongside 29.8% earnings growth over the past year. Over recent periods the company has seen revenue move from US$26.6 million and EPS of US$0.59 in Q4 2024 to US$31.9 million and EPS of US$0.71 in Q4 2025, while trailing net income has reached US$33.0 million. With net profit margin now at 27.7% versus 25.1% a year earlier, the latest results point to a business that is converting revenue into earnings with increasing efficiency.
See our full analysis for Farmers & Merchants Bancorp.With the headline numbers on the table, it is worth setting them against the most widely held narratives about Farmers & Merchants to see which views the results support and which they call into question.
27.7% net margin backed by steady quarterly profits
- Across FY 2025, net income moved from US$6.9 million in Q1 to US$9.8 million in Q4, and on a trailing basis reached US$33.0 million with a 27.7% net profit margin compared with 25.1% a year earlier.
- Supporters of a more bullish view often point to this kind of margin profile, and the data here gives them some backing but with limits:
- The trailing net income of US$33.0 million and margin at 27.7% align with the idea of a solid, profitable community bank, especially when earlier trailing revenue was US$101.2 million versus the latest US$119.4 million.
- At the same time, the longer term earnings growth rate of 4.5% per year over five years is much lower than the recent 29.8% yearly increase, so anyone leaning bullish has to decide how much weight to put on that one strong year.
Net interest margin at 3.4% with growing loan book
- Net interest margin is reported at 3.4% in Q3 2025 against 2.71% in Q3 2024, alongside total loans moving from US$2,536.8 million in Q3 2024 to US$2,659.7 million in Q3 2025 and US$2,581.9 million in Q1 2025.
- Bears often worry that a community bank’s earnings are too exposed to pressure on spreads and loan quality, and these figures cut both ways:
- The step up in net interest margin from 2.71% to 3.4%, together with higher loans over the same Q3 periods, supports the idea that interest income has been an important driver of the recent 29.8% earnings growth.
- On the other hand, non performing loans rose from US$2.9 million in Q3 2024 to US$5.2 million in Q3 2025, which gives cautious investors a concrete data point to point to when they argue that stronger spreads have come with some extra credit risk.
12.2x P/E and small gap to DCF fair value
- The shares trade on a trailing P/E of 12.2x, compared with a peer average of 13.1x and a US Banks industry average of 11.8x, and the current price of US$29.57 sits close to a DCF fair value estimate of US$29.91.
- What stands out for more cautious investors is how these valuation markers sit against the growth profile:
- Earnings are forecast to grow about 8.1% per year while revenue is expected to grow about 1% per year, which is slower than a 15.7% forecast for the broader US market, so the P/E premium to the industry average of 11.8x is not backed by faster revenue expansion.
- With the DCF fair value at US$29.91 only slightly above the US$29.57 share price, valuation signals are fairly tight, which leaves less room for error if future earnings growth were to fall below the current 8.1% forecast.
Next Steps
Don't just look at this quarter; the real story is in the long-term trend. We've done an in-depth analysis on Farmers & Merchants Bancorp's growth and its valuation to see if today's price is a bargain. Add the company to your watchlist or portfolio now so you don't miss the next big move.
See What Else Is Out There
The combination of modest long term earnings growth, slower forecast revenue growth and a P/E premium to the industry suggests the current valuation leaves limited room for disappointment.
If that tight margin for error feels uncomfortable, use our 86 resilient stocks with low risk scores to quickly spot companies with more conservative risk profiles that could better balance your portfolio.
This article by Simply Wall St is general in nature. We provide commentary based on historical data and analyst forecasts only using an unbiased methodology and our articles are not intended to be financial advice. It does not constitute a recommendation to buy or sell any stock, and does not take account of your objectives, or your financial situation. We aim to bring you long-term focused analysis driven by fundamental data. Note that our analysis may not factor in the latest price-sensitive company announcements or qualitative material. Simply Wall St has no position in any stocks mentioned.