Hanover Insurance Group (THG) has released its FY 2025 numbers with fourth quarter revenue of US$1,671.8 million and basic EPS of US$5.52, capped off by trailing twelve month revenue of US$6.6 billion and EPS of US$18.51. Over recent reporting periods the company has seen revenue move from US$1,584.3 million and EPS of US$4.65 in Q4 2024 to US$1,671.8 million and EPS of US$5.52 in Q4 2025. Trailing net income reached US$660.7 million and margins sat at 10% over the last year, giving investors a set of results anchored in underwriting profitability.
See our full analysis for Hanover Insurance Group.
With the latest earnings on the table, the next step is to see how these margin and profit trends line up with the prevailing stories around Hanover, and where the numbers push back on the widely held narratives.
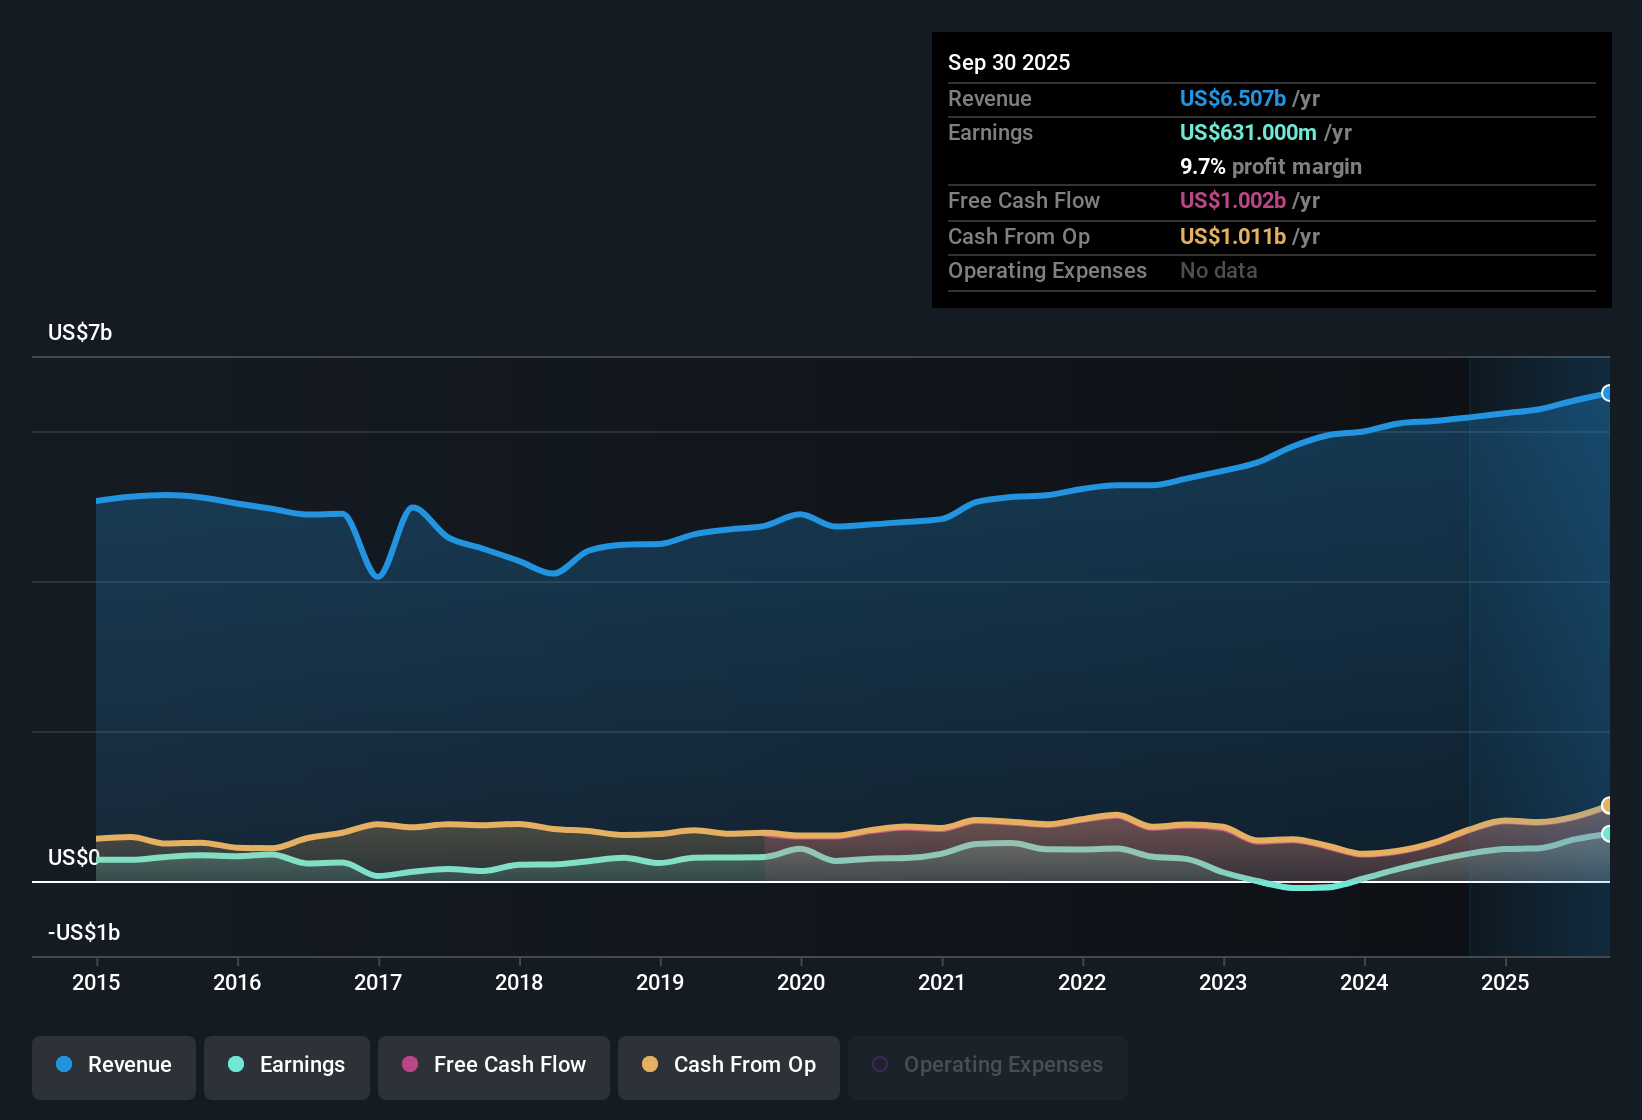
NYSE:THG Earnings & Revenue History as at Feb 2026
TTM profit jumps 55.3% versus 5.5% trend
Over the last 12 months, net income excluding extra items reached US$660.7 million and grew 55.3% compared with a 5 year pace of 5.5% per year. This sits on top of trailing revenue of about US$6.6b and a 10% net margin.
For a more bullish view, it is interesting to see how this profit profile lines up with the data, where:
Revenue on a trailing basis is reported at roughly US$6.6b, while margin moved to 10% from 6.8%. This indicates that most of the 55.3% earnings expansion comes with relatively moderate revenue growth of about 4.5% per year.
This stronger recent earnings pace versus the 5.5% 5 year trend supports the angle that the business has been converting its premium and fee base into profit more efficiently over the last year, even though that does not speak to what happens next.
To see how this profitability shift fits into the bigger story, including risks around how long it might last, check out the latest balanced narrative on the company.
📊 Read the full Hanover Insurance Group Consensus Narrative.
Combined ratio trends underpin underwriting story
Across FY 2025, combined ratios moved from 94.1% in Q1 2025 to 92.5% in Q2 and 91.1% in Q3, while the trailing 12 month net margin sat at 10%, giving a clearer picture of underwriting and overall profitability than the headline EPS alone.
Critics taking a more cautious, bearish angle might question how durable this is, yet:
The step down in combined ratios within 2025 coincides with quarterly net income excluding extra items moving from US$128.2 million in Q1 to US$156.9 million in Q2 and US$178.6 million in Q3, which suggests underwriting and expense discipline played a big role in the trailing 10% margin.
At the same time, the trailing 12 month combined ratio reference of 94.8% in Q4 2024 versus the later quarterly figures shows the more recent underwriting picture has been tighter than that earlier full year snapshot, which challenges a purely bearish view that profitability is weak at the insurance operations level.
P/E of 9.4x with DCF fair value at US$394.73
The shares trade on a 9.4x P/E at a price of US$175.07, which is below the US insurance industry average of 13.3x and peer average of 11.9x. The DCF fair value in the data is US$394.73 and the model also flags a 2.17% dividend yield.
Bears looking at forward forecasts point to the 2.1% expected annual earnings decline over the next three years, and the numbers set up a clear tension:
On one side, the model sees the current price at roughly 55.6% below its DCF fair value, and the trailing 55.3% earnings rise over the last year supports the idea that the trailing fundamentals are strong at today’s multiple.
On the other side, the same dataset showing that forecast 2.1% annual earnings decline means the valuation gap and 2.17% yield sit alongside a softer forward profit profile, which bearish investors see as a key check on how they interpret the low P/E and high model fair value.
Next Steps
Don't just look at this quarter; the real story is in the long-term trend. We've done an in-depth analysis on Hanover Insurance Group's growth and its valuation to see if today's price is a bargain. Add the company to your watchlist or portfolio now so you don't miss the next big move.
See What Else Is Out There
Despite a strong trailing profit picture and low P/E, the 2.1% expected annual earnings decline raises questions about the sustainability of this earnings profile.
If that softer outlook concerns you, consider exploring high growth potential stocks screener (51 results) today to review established companies that analysts currently expect to have firmer earnings growth over the next few years.
This article by Simply Wall St is general in nature. We provide commentary based on historical data and analyst forecasts only using an unbiased methodology and our articles are not intended to be financial advice. It does not constitute a recommendation to buy or sell any stock, and does not take account of your objectives, or your financial situation. We aim to bring you long-term focused analysis driven by fundamental data. Note that our analysis may not factor in the latest price-sensitive company announcements or qualitative material. Simply Wall St has no position in any stocks mentioned.