Has Broadcom’s AI Powered Surge in 2025 Pushed Its Valuation Too Far?
Broadcom Limited AVGO | 0.00 |
- Wondering if Broadcom is still worth buying after its massive run, or if you are turning up late to the party? This breakdown will help you figure out whether the current price stacks up against its fundamentals.
- Over the last week the stock is up 7.1%, even after a 7.6% slide over the past month, and it is still boasting a hefty 50.6% gain year to date and 47.1% over the last year, on top of eye catching 3 and 5 year returns of 570.5% and 793.0% respectively.
- Recent headlines have focused on Broadcom's role as a key enabler in AI infrastructure and cloud data centers, with investors increasingly viewing it as a backbone supplier to hyperscalers and enterprise customers. The company has also been in the spotlight for its strategy of pairing high margin semiconductor solutions with software and networking assets, a mix that many see as supporting long term pricing power and cash generation.
- Despite that strong narrative, Broadcom only scores 1/6 on our valuation checks. This suggests that much of the optimism may already be priced in. Next we will unpack how different valuation approaches view the stock today, before finishing with an even more intuitive way to think about what its current price really implies.
Broadcom scores just 1/6 on our valuation checks. See what other red flags we found in the full valuation breakdown.
Approach 1: Broadcom Discounted Cash Flow (DCF) Analysis
A Discounted Cash Flow model estimates what a company is worth today by projecting its future cash flows and then discounting them back to their value in today’s dollars.
For Broadcom, the latest twelve month Free Cash Flow is about $26.9 billion. Analysts and extrapolations used in this 2 Stage Free Cash Flow to Equity model see FCF rising to roughly $107.1 billion by 2030, with intermediate years stepping up from about $44.5 billion in 2026 to $77.9 billion in 2028, before moving higher again into the next decade.
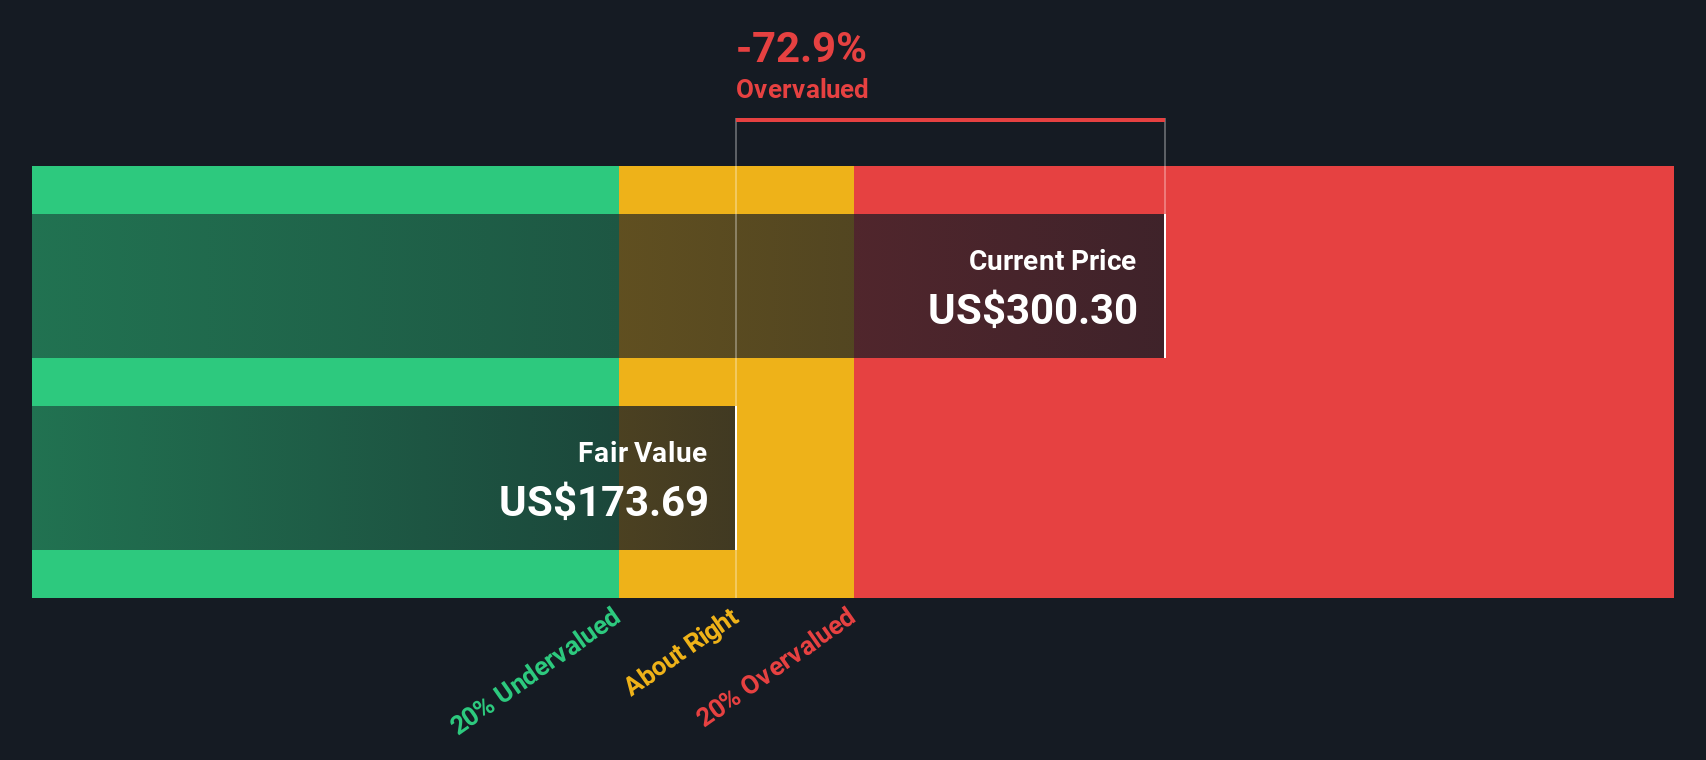
Simply Wall St discounts these projected cash flows to reflect risk and the time value of money. This produces an estimated intrinsic value of around $287.81 per share. Compared with the current share price, that implies Broadcom is about 21.4% overvalued on this cash flow view, suggesting that a lot of optimistic AI and growth expectations are already embedded in the stock.
Result: OVERVALUED
Our Discounted Cash Flow (DCF) analysis suggests Broadcom may be overvalued by 21.4%. Discover 908 undervalued stocks or create your own screener to find better value opportunities.
Approach 2: Broadcom Price vs Earnings
For profitable, mature businesses like Broadcom, the price to earnings ratio is often the cleanest way to judge value because it links what investors are paying directly to the company’s current earning power. In general, faster earnings growth and lower perceived risk justify a higher PE ratio, while slower growth or bumpier earnings usually call for a lower, more conservative multiple.
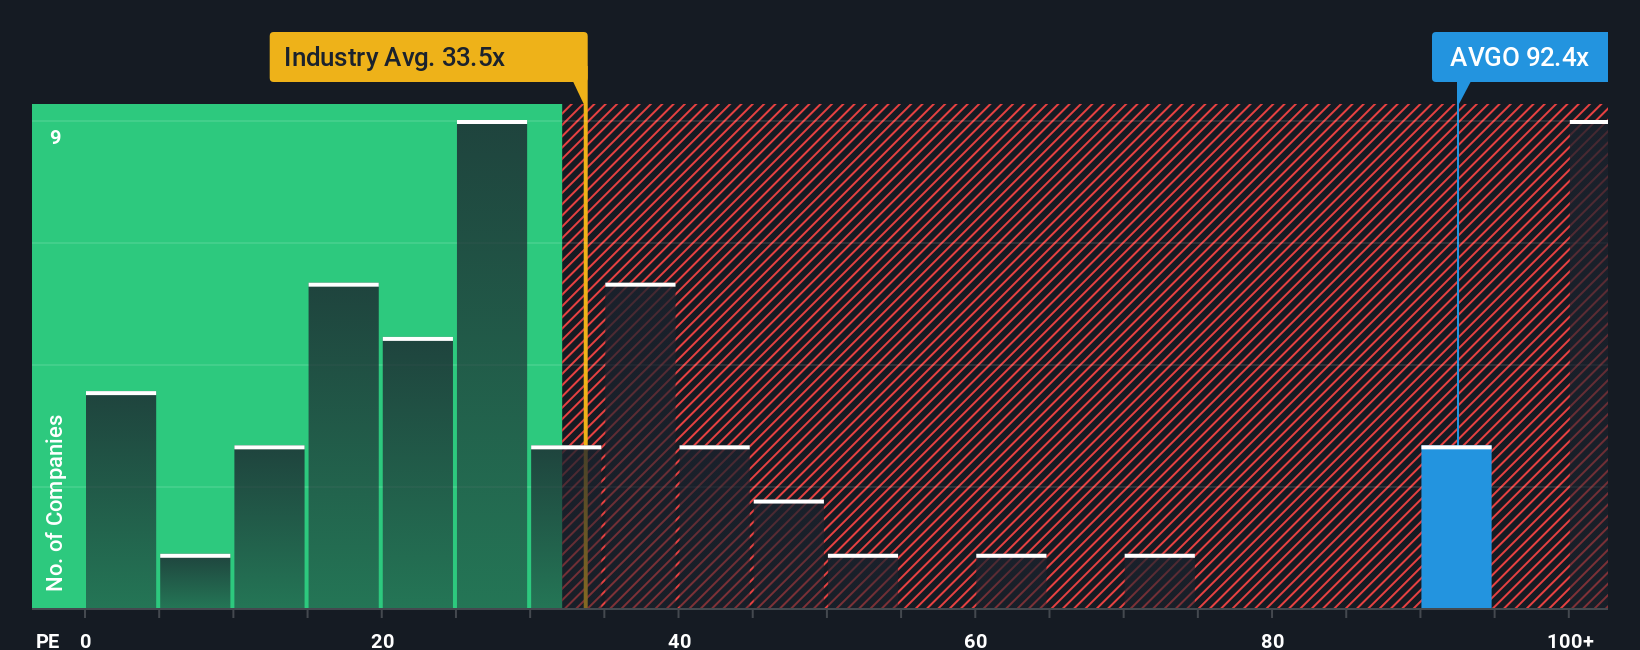
Broadcom currently trades on about 71.62x earnings. That is well above both the broader Semiconductor industry average of roughly 36.67x and the peer group average of about 54.43x, which suggests the market is pricing in superior growth and resilience. To refine this view, Simply Wall St calculates a proprietary “Fair Ratio” of 55.11x, which reflects Broadcom’s specific earnings growth outlook, profit margins, risk profile, industry positioning and market cap. This tailored Fair Ratio is more informative than simple peer or industry comparisons because it adjusts for the company’s own fundamentals rather than assuming one size fits all.
Stacking Broadcom’s current 71.62x PE against the 55.11x Fair Ratio points to a premium that appears difficult to justify on fundamentals alone, indicating the shares are trading above what its earnings profile would typically warrant.
Result: OVERVALUED
PE ratios tell one story, but what if the real opportunity lies elsewhere? Discover 1457 companies where insiders are betting big on explosive growth.
Upgrade Your Decision Making: Choose your Broadcom Narrative
Earlier we mentioned that there is an even better way to understand valuation, so let us introduce you to Narratives, a simple way to turn your view of Broadcom into a story that links its business drivers to a financial forecast and, ultimately, a fair value estimate. On Simply Wall St’s Community page, Narratives let you describe why you think Broadcom’s revenue, earnings and margins will evolve in a certain way, then automatically translate that story into projected cash flows, a Fair Value, and a clear comparison with today’s share price so you can decide whether it looks like a buy, hold or sell. Because Narratives update dynamically as new news, earnings and guidance arrive, your view stays current without you having to rebuild a model from scratch. For example, one investor might build a bullish Broadcom Narrative that leans heavily on accelerating AI chip demand, VMware integration and a Fair Value near the higher analyst target range, while another might emphasize customer concentration, competitive threats and integration risk, landing closer to the most cautious Fair Value at the bottom of the range.
Do you think there's more to the story for Broadcom? Head over to our Community to see what others are saying!
This article by Simply Wall St is general in nature. We provide commentary based on historical data and analyst forecasts only using an unbiased methodology and our articles are not intended to be financial advice. It does not constitute a recommendation to buy or sell any stock, and does not take account of your objectives, or your financial situation. We aim to bring you long-term focused analysis driven by fundamental data. Note that our analysis may not factor in the latest price-sensitive company announcements or qualitative material. Simply Wall St has no position in any stocks mentioned.