
Please use a PC Browser to access Register-Tadawul
Get It
Has The Market Rerated Pediatrix Medical Group (MD) Too Cautiously After Its 57.9% Surge?
Pediatrix Medical Group, Inc. MD | 18.82 | -2.49% |
The Discounted Cash Flow, or DCF, model estimates what a company could be worth by projecting its future cash flows and then discounting those back to today’s dollars. It is essentially asking what Pediatrix Medical Group’s future cash generation might be worth right now.
Pediatrix Medical Group reports last twelve month free cash flow of about $264.9 million. The model used here is a 2 Stage Free Cash Flow to Equity approach, which first uses analyst inputs and then extends them with further projections. For example, projected free cash flow in 2027 is $182.1 million, and Simply Wall St extrapolates this out to 2035 with a series of annual estimates, each discounted back to today using its own assumptions.
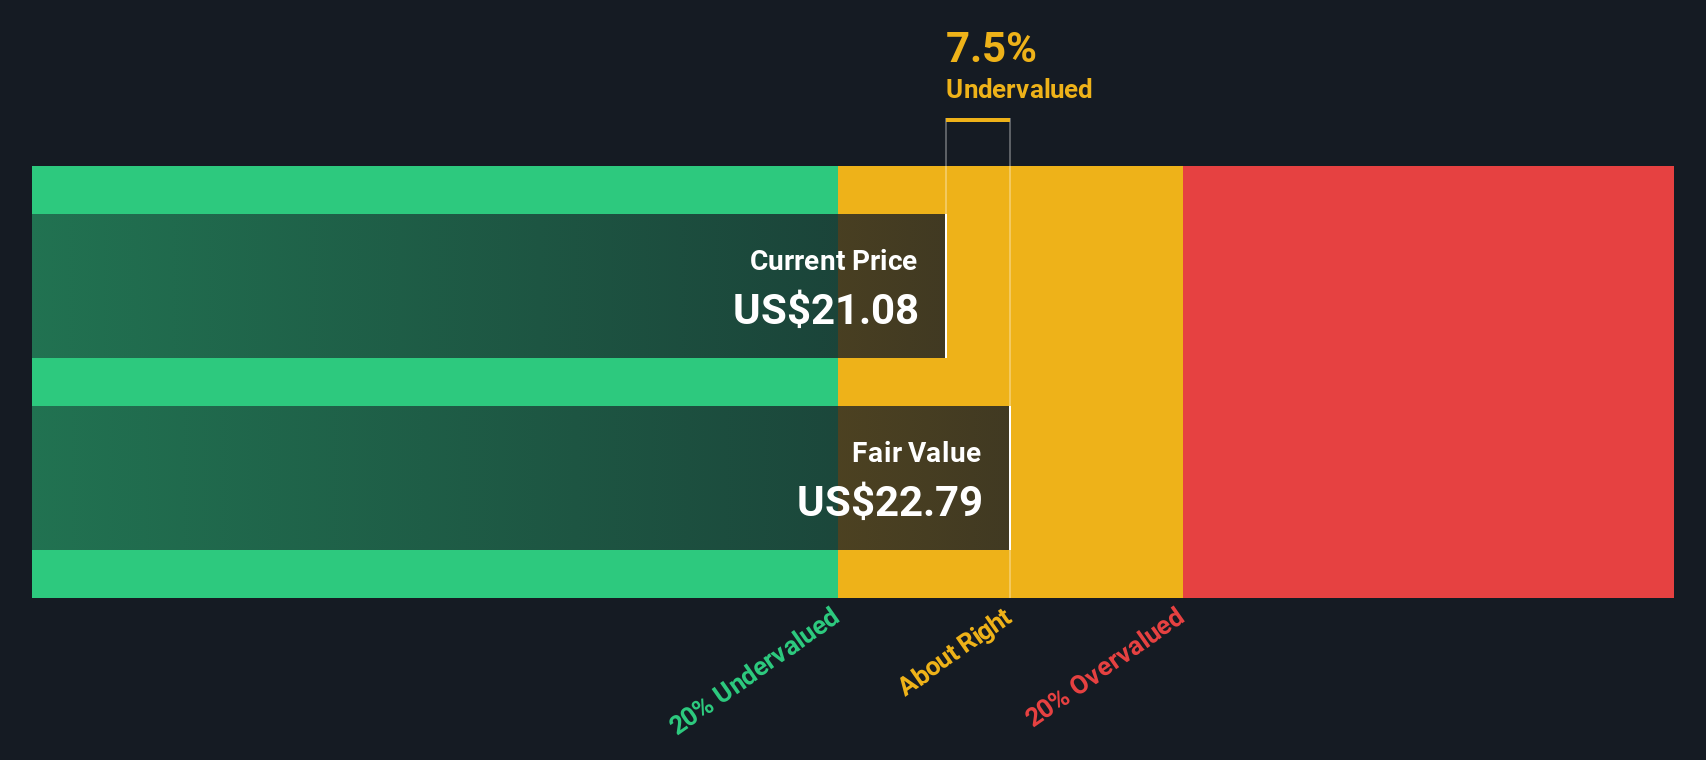
Pulling all of these discounted cash flows together, the DCF output suggests an intrinsic value of about $37.38 per share. Compared with a recent share price of roughly $21.86, this implies Pediatrix Medical Group is trading at a 41.5% discount to that estimate, which the model interprets as undervalued.
Result: UNDERVALUED
Our Discounted Cash Flow (DCF) analysis suggests Pediatrix Medical Group is undervalued by 41.5%. Track this in your watchlist or portfolio, or discover 863 more undervalued stocks based on cash flows.
For a profitable company like Pediatrix Medical Group, the P/E ratio is a useful way to think about value, because it links what you pay today with the earnings the business is already generating. In simple terms, higher growth potential and lower perceived risk tend to support a higher P/E, while slower growth and higher risk usually line up with a lower P/E.
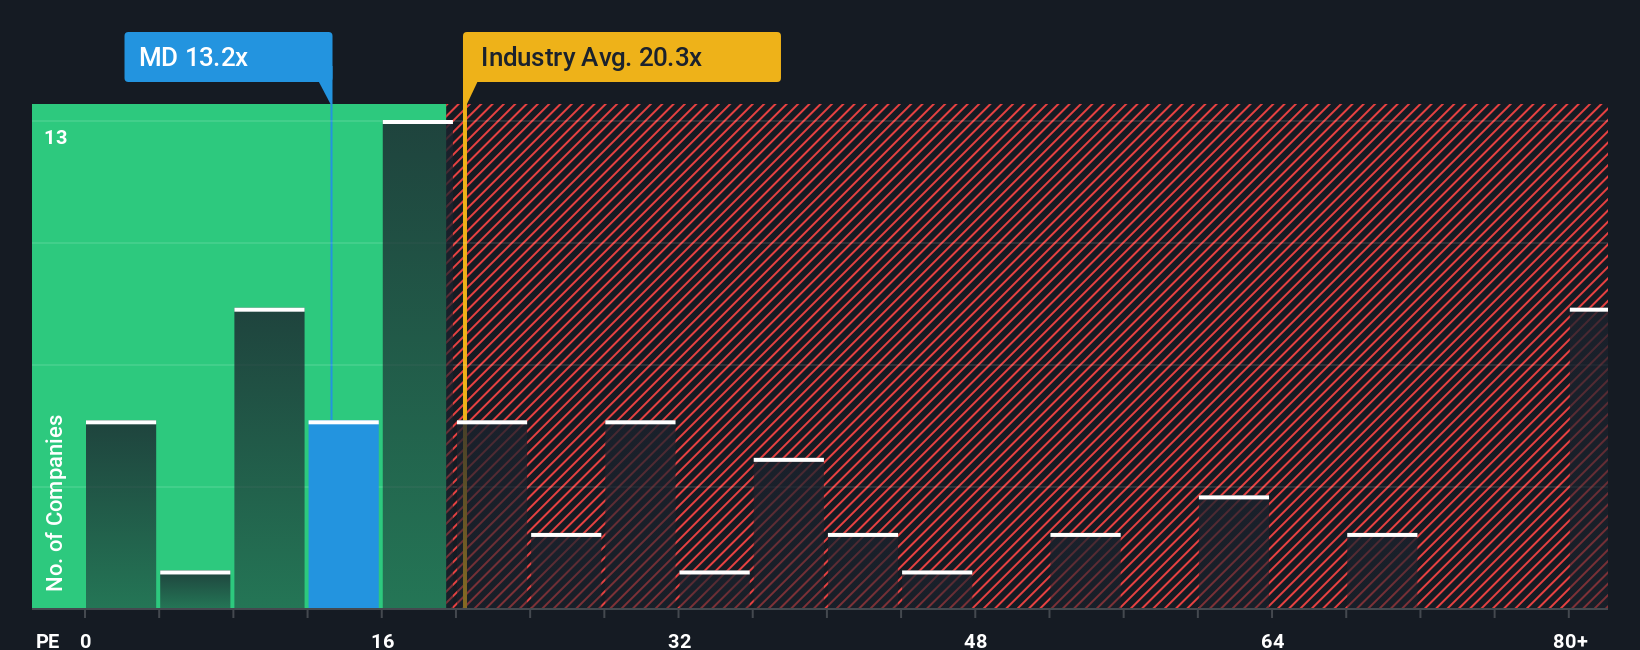
Pediatrix Medical Group currently trades on a P/E of 11.35x. That sits below the broader Healthcare industry average P/E of 23.49x, and also well below a peer group average of 76.06x. On the surface, that gap suggests the market is placing a lower value on each dollar of earnings compared with many other healthcare stocks.
Simply Wall St’s Fair Ratio for Pediatrix Medical Group is 16.29x. This is its own estimate of an appropriate P/E when you factor in elements like earnings growth profile, industry, profit margins, market cap and specific risks. This tailored yardstick is often more informative than a straight comparison with peers or industry averages, because those benchmarks can mix companies with very different business qualities. Set against that Fair Ratio, the current 11.35x P/E sits meaningfully lower, which indicates that the shares are trading below that reference level.
Result: UNDERVALUED
P/E ratios tell one story, but what if the real opportunity lies elsewhere? Discover 1445 companies where insiders are betting big on explosive growth.
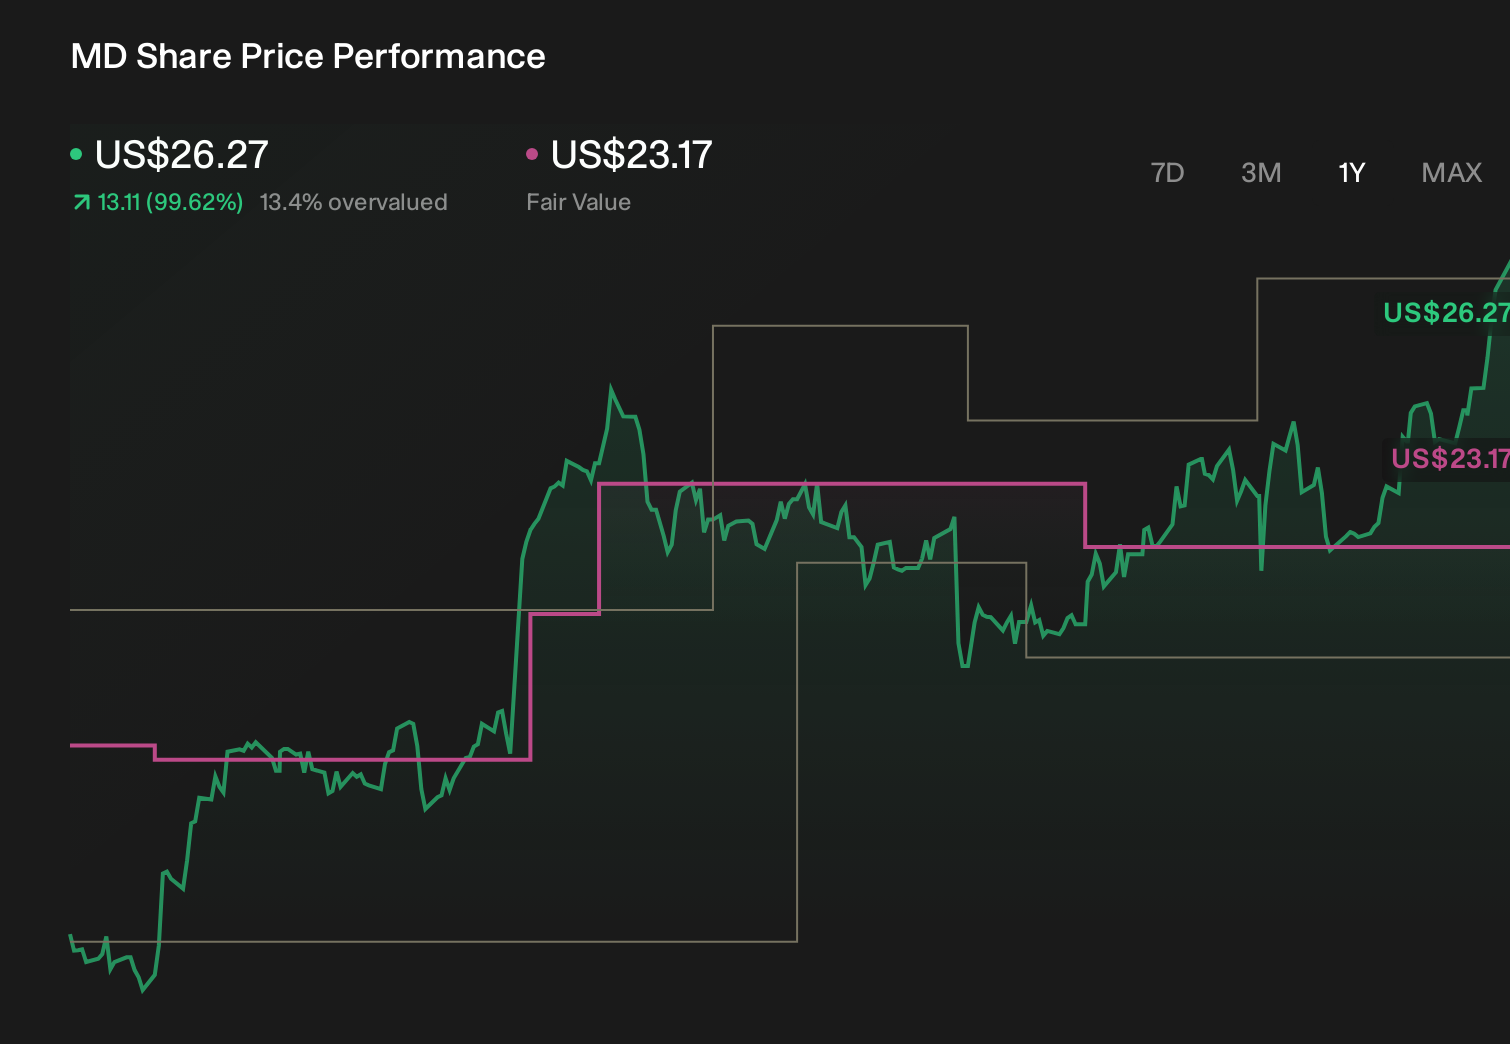
Earlier we mentioned that there is an even better way to understand valuation, so let us introduce you to Narratives, a simple way for you to write the story you see for Pediatrix Medical Group, link that story to your own revenue, earnings and margin estimates, and turn it into a Fair Value that you can compare with the current price on Simply Wall St’s Community page. Narratives are updated automatically when new information like news or earnings arrives. For example, one Pediatrix Narrative might see a Fair Value of about US$22.67 based on modest growth and stable margins, while another uses the lowest analyst target of US$13.00. By comparing those different fair values with today’s share price, you can decide for yourself whether the stock looks closer to fairly priced or offers a margin of safety according to your own view.
Do you think there's more to the story for Pediatrix Medical Group? Head over to our Community to see what others are saying!
This article by Simply Wall St is general in nature. We provide commentary based on historical data and analyst forecasts only using an unbiased methodology and our articles are not intended to be financial advice. It does not constitute a recommendation to buy or sell any stock, and does not take account of your objectives, or your financial situation. We aim to bring you long-term focused analysis driven by fundamental data. Note that our analysis may not factor in the latest price-sensitive company announcements or qualitative material. Simply Wall St has no position in any stocks mentioned.
