Has The Pullback In Science Applications International (SAIC) Opened A Valuation Opportunity?
Science Applications International Corp. SAIC | 95.23 95.23 | -1.01% 0.00% Pre |
- If you are wondering whether Science Applications International is starting to look interesting at current levels, this article will walk through what that price actually implies for its underlying value.
- The stock closed at US$86.61, with returns of an 11.9% decline over the past 7 days, a 19.9% decline over 30 days, a 14.4% decline year to date and a 13.0% decline over 1 year, as well as a roughly flat 0.1% gain over 5 years, which may have shifted how investors see its risk and potential reward.
- Recent attention around Science Applications International has focused on its role as a government and commercial services contractor, where contract wins, renewals or changes in spending priorities can quickly affect sentiment even without headline grabbing announcements. This backdrop helps explain why the share price can move sharply over short periods, as investors react to how they think the company is positioned in its core markets.
- On our valuation checks, Science Applications International scores a perfect 6 out of 6. Next, we will walk through the different valuation approaches behind that score, before closing with a simple framework that can help you make even more sense of what the numbers really mean.
Approach 1: Science Applications International Discounted Cash Flow (DCF) Analysis
A Discounted Cash Flow, or DCF, model estimates what a business could be worth by projecting the cash it is expected to generate in the future and then discounting those cash flows back to today.
For Science Applications International, the model starts with last twelve months free cash flow of about $435.2 million. Analysts provide explicit free cash flow estimates for the next few years, and Simply Wall St extrapolates further out to build a longer term picture. In this case, the ten year projection includes estimated free cash flow of $550.8 million in 2035, all expressed in $ and discounted back to today using a 2 Stage Free Cash Flow to Equity approach.
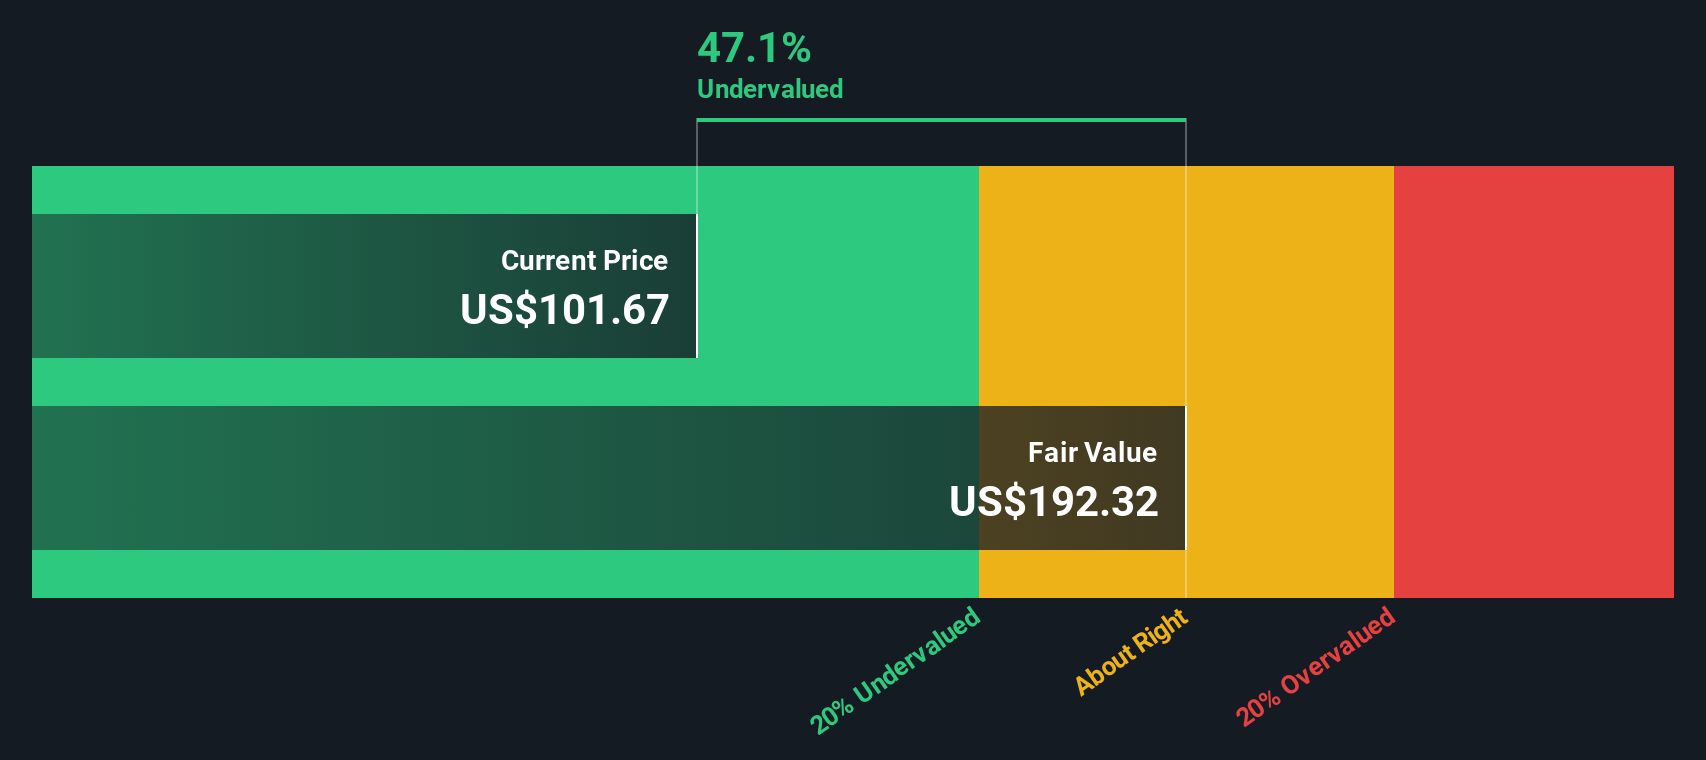
Putting all of those discounted cash flows together gives an estimated intrinsic value of $195.42 per share, compared with the recent share price of $86.61. That implies the shares trade at a 55.7% discount to this DCF estimate, which points to a wide gap between the modeled value and where the market is currently pricing the stock.
Result: UNDERVALUED
Our Discounted Cash Flow (DCF) analysis suggests Science Applications International is undervalued by 55.7%. Track this in your watchlist or portfolio, or discover 53 more high quality undervalued stocks.
Approach 2: Science Applications International Price vs Earnings
For profitable companies, the P/E ratio is a useful shorthand because it links what you pay directly to the earnings the business is already generating. It gives you a quick sense of how many dollars of price you are paying for each dollar of current earnings.
What counts as a “normal” P/E often reflects two things: how the market views a company’s growth potential, and how risky those future earnings look. Higher expected growth or lower perceived risk can justify a higher P/E, while slower growth or higher uncertainty usually lines up with a lower multiple.
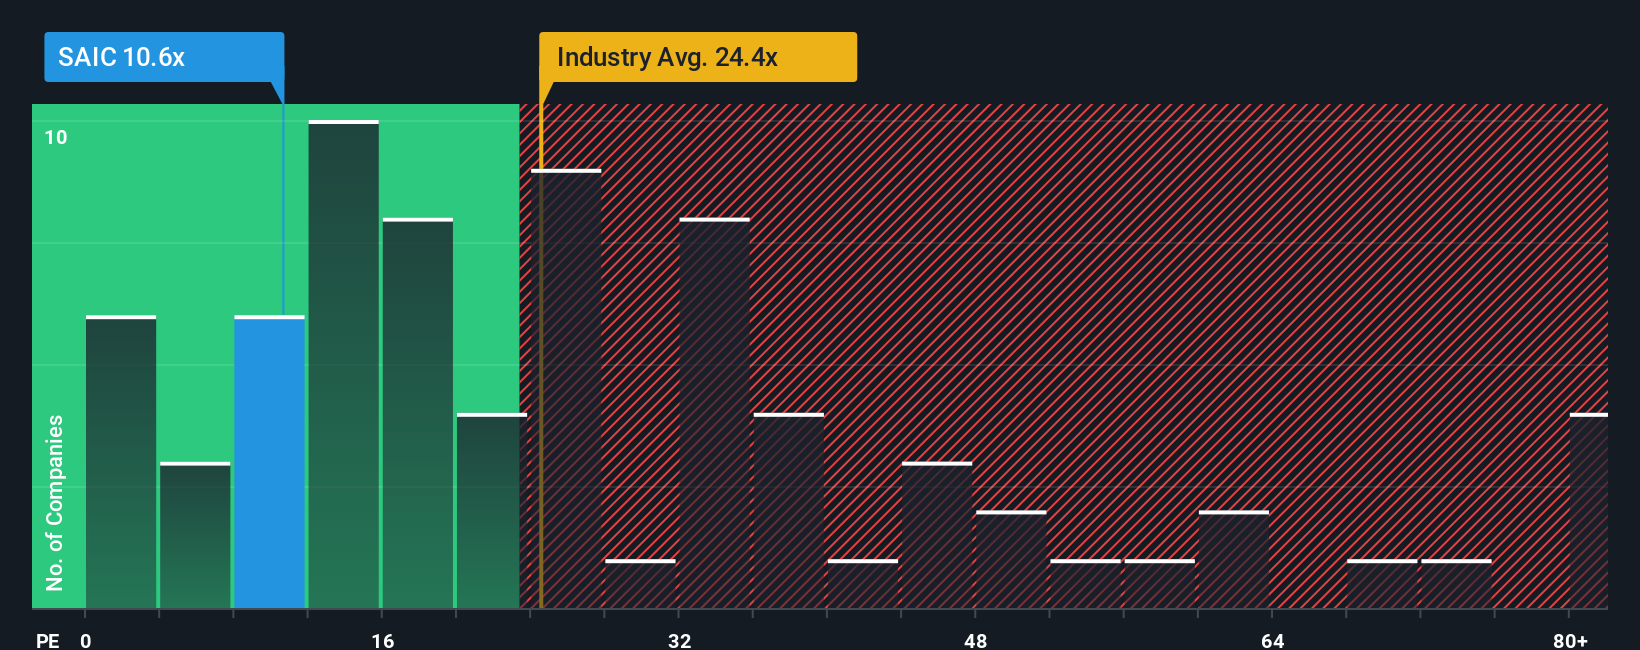
Science Applications International currently trades on a P/E of 10.54x. This sits below the Professional Services industry average P/E of 19.40x and also below the peer group average of 16.81x. Simply Wall St’s Fair Ratio for the stock is 19.15x, which is the P/E level that their model suggests based on factors like earnings growth, industry, profit margin, market cap and risk. Because the Fair Ratio incorporates these company specific drivers rather than just broad comparisons, it can be a more tailored benchmark. With a Fair Ratio of 19.15x versus the current 10.54x, the multiple points to the shares trading below that modeled level.
Result: UNDERVALUED
P/E ratios tell one story, but what if the real opportunity lies elsewhere? Start investing in legacies, not executives. Discover our 23 top founder-led companies.
Upgrade Your Decision Making: Choose your Science Applications International Narrative
Earlier we mentioned that there is an even better way to understand valuation. Let us introduce Narratives, which are simply your story about a company, linked directly to your own assumptions for future revenue, earnings, margins and fair value, and then compared with today’s share price to help you decide whether the current price looks high or low against that story.
On Simply Wall St’s Community page, Narratives are available as an easy tool used by millions of investors. Each one connects a view of the business to a full forecast and a fair value estimate that automatically updates when new information such as earnings, guidance changes or contract news is added.
For Science Applications International, one investor might build a Narrative similar to the more optimistic case with a fair value of US$133.00 per share. Another might prefer a more cautious view closer to US$94.00 per share. By setting up both Narratives side by side you can see how different assumptions lead to different fair values and decide where your own view sits relative to the current share price.
Do you think there's more to the story for Science Applications International? Head over to our Community to see what others are saying!

This article by Simply Wall St is general in nature. We provide commentary based on historical data and analyst forecasts only using an unbiased methodology and our articles are not intended to be financial advice. It does not constitute a recommendation to buy or sell any stock, and does not take account of your objectives, or your financial situation. We aim to bring you long-term focused analysis driven by fundamental data. Note that our analysis may not factor in the latest price-sensitive company announcements or qualitative material. Simply Wall St has no position in any stocks mentioned.