
Please use a PC Browser to access Register-Tadawul
Get It
How Does Exxon’s Superior Graphite Deal Impact Its Valuation in 2025?
Exxon Mobil Corporation XOM | 117.64 | -0.99% |
If you are scratching your head about what to do with Exxon Mobil stock these days, you are definitely not alone. With its mix of strong history and a flurry of recent headlines, the company keeps making investors rethink what’s possible. Take a look at the numbers: Exxon Mobil’s stock is up 3.6% over the past week, 7.7% in the last month, and nearly 7% for the year to date. If you zoom out a bit further, you see tidy growth of 4.1% over the past year and a blockbuster 300.9% over the last five years. That kind of performance makes it more than just a blue-chip snoozer.
Of course, these moves are connected to how Exxon Mobil is positioning itself. Just recently, the company announced it is buying major assets from Superior Graphite to fuel its electric vehicle ambitions, which is a bold step beyond traditional oil and gas territory. Meanwhile, market watchers are keeping tabs on oil supply news, such as the OPEC+ decision to boost October production. While those headlines can send short-term ripples through energy stocks, Exxon’s diversified strategies might help balance out any wild swings in commodity prices.
For investors who care about getting in at the right price, valuation matters. Out of six key valuation checks, Exxon scores well in four, giving it a value score of 4. But before you make any moves, let’s break down these valuation methods piece by piece. And stick around, because at the end, I’ll share what I think is an even better way to cut through the valuation noise and see the big picture for Exxon Mobil.
Why Exxon Mobil is lagging behind its peersThe Discounted Cash Flow (DCF) model estimates what a company is really worth by forecasting its future free cash flows and then discounting those amounts back to today’s dollars. For Exxon Mobil, this involves taking projections for annual free cash flow growth and determining what that could look like over the next decade.
Currently, Exxon Mobil is generating free cash flow (FCF) of $32.4 billion. Analyst estimates and further extrapolations anticipate this will grow steadily, reaching around $55.6 billion by 2035. In five years, the forecast FCF is $44.9 billion. Most long-term projections beyond that point rely on extrapolations by Simply Wall St because analyst coverage decreases further into the future.
Based on the two-stage free cash flow to equity DCF analysis, the estimated intrinsic value for Exxon Mobil is $252.71 per share. Compared to the current share price, this suggests the market price is about 54.6% below its calculated intrinsic value, indicating the stock is deeply undervalued according to this model.
Result: UNDERVALUED
Head to the Valuation section of our Company Report for more details on how we arrive at this Fair Value for Exxon Mobil.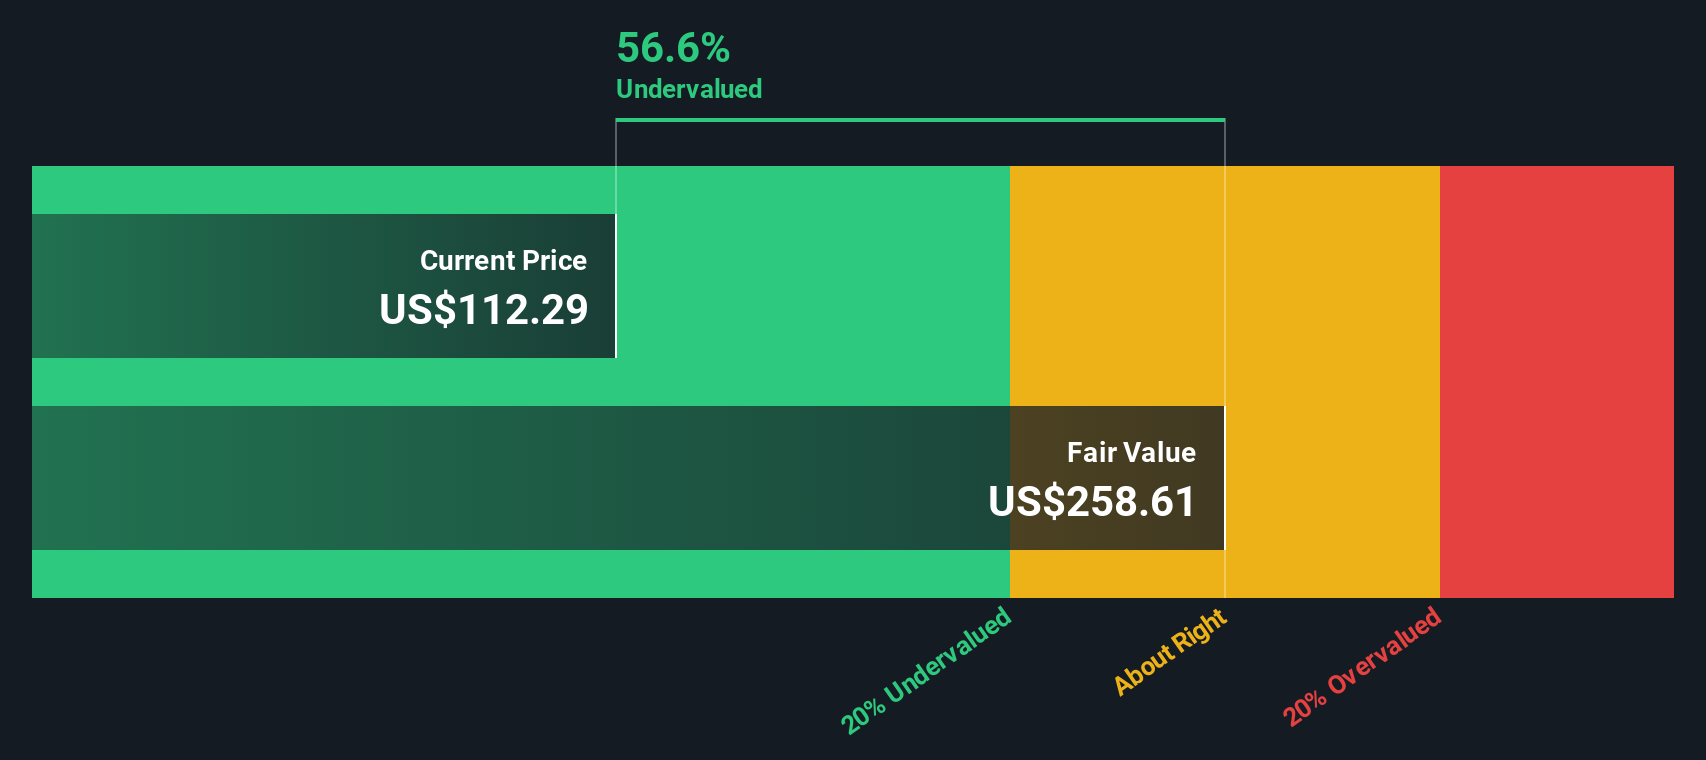
For established and consistently profitable companies like Exxon Mobil, the price-to-earnings (PE) ratio is a reliable way to value the business. The PE ratio measures what investors are willing to pay today for each dollar of earnings, making it especially useful for companies with solid profit histories.
But not all PE ratios are created equal. What counts as a "normal" or "fair" PE depends on how quickly a company is expected to grow and how much risk comes with those expectations. Fast-growing or lower-risk companies often fetch higher PE multiples, while slow-growing or riskier firms trade at lower ones.
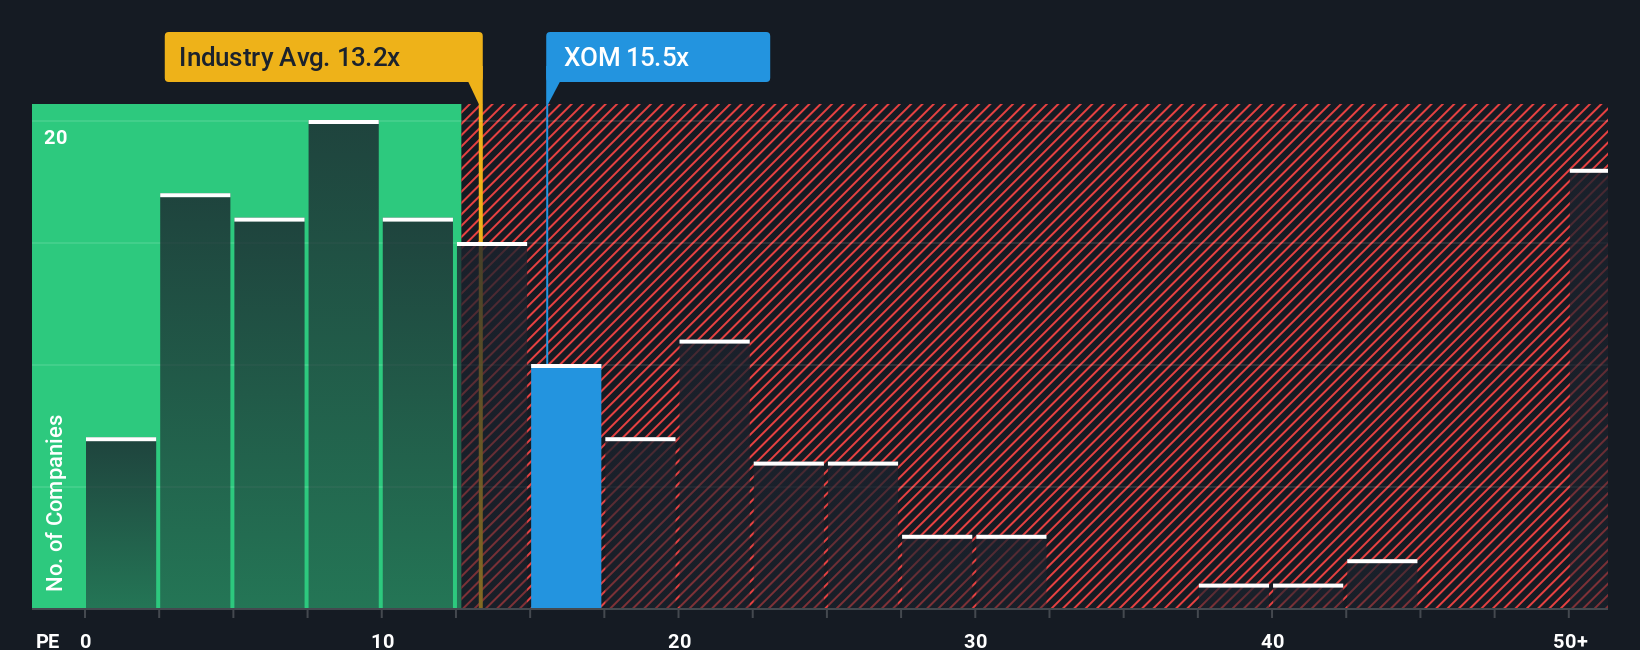
Exxon Mobil's current PE ratio stands at 15.8x, which is above the Oil and Gas industry average of 13.2x but comfortably below the peer group average of 23.2x. To get a more tailored perspective, we look at the Simply Wall St Fair Ratio, which for Exxon Mobil is 20.5x. This proprietary metric accounts for Exxon’s anticipated earnings growth, profit margin, sector profile, company size, and risk factors. It provides a fairer yardstick than broad industry or peer comparisons alone.
Stacking up these numbers, Exxon's actual PE is notably lower than its Fair Ratio. This suggests the stock may be undervalued relative to what a well-rounded analysis would justify.
Result: UNDERVALUED
Earlier we mentioned that there is an even better way to understand valuation, so let’s introduce you to Narratives, a smarter, more dynamic way to make investment decisions that goes beyond traditional number crunching. A Narrative is your story about a company, where you connect your perspective on Exxon Mobil’s future to estimates for key financials like revenue, profit margins, and ultimately, fair value. Narratives don’t just summarize where the numbers land; they let you frame how and why those numbers might play out, blending your reasoning with real forecasts.
On Simply Wall St’s Community page, Narratives are an easy and accessible tool used by millions of investors to sketch out, share, and refine their investment thesis. This approach helps you see when your numbers suggest buying or selling by directly comparing fair value, based on your Narrative, to the current price. Best of all, Narratives update dynamically as fresh news, analysis, or earnings roll in so your outlook stays relevant.
For example, one investor’s Narrative puts Exxon Mobil’s fair value at $132 (17.5% upside), emphasizing operational transformation and capital discipline, while another forecasts a higher upside to $174 by 2030, citing Guyana’s rapid growth and higher earnings. Which story fits your view? That is the value of building your own Narrative.
Do you think there's more to the story for Exxon Mobil? Create your own Narrative to let the Community know!
This article by Simply Wall St is general in nature. We provide commentary based on historical data and analyst forecasts only using an unbiased methodology and our articles are not intended to be financial advice. It does not constitute a recommendation to buy or sell any stock, and does not take account of your objectives, or your financial situation. We aim to bring you long-term focused analysis driven by fundamental data. Note that our analysis may not factor in the latest price-sensitive company announcements or qualitative material. Simply Wall St has no position in any stocks mentioned.
