How Target’s Stock Stacks Up After Price-Matching Policy Ends
Target Corporation TGT | 120.45 | 0.00% |
If you are watching Target’s stock and wondering whether now is the time to buy, sell, or hold, you are definitely not alone. After all, Target's share price has taken quite a ride lately. The stock closed at $87.05, having dropped 3.0% in the last week and a striking 12.3% over the past month. Taking a longer view, the story gets even more dramatic, with year-to-date returns at -36.5% and a 1-year drop of 42.1%. Over five years, investors are looking at a decline of almost 37%.
What’s been causing these sharp moves? Some of it stems from Target-specific news, like their decision to end price-matching, a policy that many shoppers valued for its flexibility and perceived fairness. More recently, a staff survey revealed that about 40% of Target employees lacked confidence in the company’s direction, and that kind of internal sentiment can definitely impact how investors assess future risk. Meanwhile, Target is also facing competitive pressure on the retail front, especially with Walmart rolling out bigger employee discounts on groceries to sweeten the deal for both staff and customers.
Despite the headline turbulence, here is where things get interesting for value-focused investors: by a rigorous six-part undervaluation checklist, Target scores an impressive 5 out of 6. That means the company appears undervalued on nearly every major metric, potentially hinting at opportunity amid the uncertainty.
So, how does Target really stack up under different valuation approaches, and is there a smarter way to put all those numbers in context? Let’s break down the key valuation methods, and at the end, I’ll share an even better way to weigh if Target truly deserves a place in your portfolio.
Why Target is lagging behind its peersApproach 1: Target Discounted Cash Flow (DCF) Analysis
The Discounted Cash Flow (DCF) model estimates a company's intrinsic value by projecting its future cash flows and discounting them back to the present day. This approach helps investors figure out what a business could be worth today if you accounted for all the money it is expected to generate in the future.
For Target, the most recent twelve months of Free Cash Flow (FCF) comes in at $2.26 Billion. Analyst projections run the numbers forward and expect annual FCF to reach $3.49 Billion by 2030. These first five years of cash flow growth are based on various analyst estimates. Any projections beyond that rely on extrapolations from Simply Wall St’s models.
Using this method, the DCF analysis puts Target's fair value at $156.29 per share. With the current share price sitting at $87.05, this model suggests the stock is trading at a significant 44.3% discount to its intrinsic value. In other words, if these future growth assumptions hold, the stock appears considerably undervalued right now.
Result: UNDERVALUED
Head to the Valuation section of our Company Report for more details on how we arrive at this Fair Value for Target.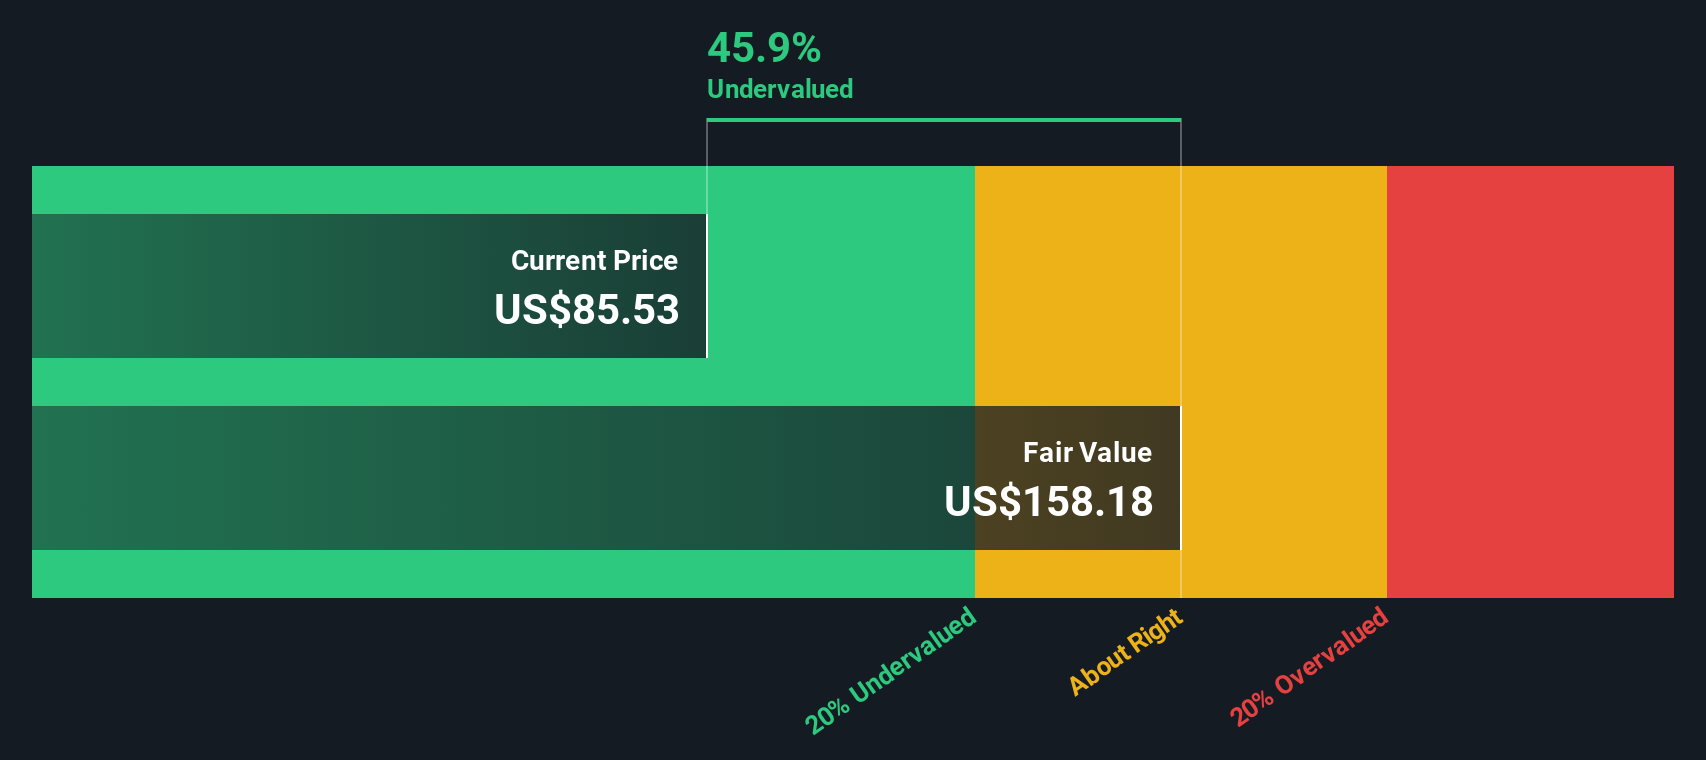
Approach 2: Target Price vs Earnings
For companies like Target that are consistently profitable, the Price-to-Earnings (PE) ratio is a widely accepted and straightforward method of valuation. The PE ratio helps investors compare what they are paying for each dollar of earnings, making it especially useful for established businesses where earnings are reliable and a key driver of value.
A company’s “normal” or “fair” PE ratio is influenced by how fast it is expected to grow, as well as its risk profile. Generally, faster-growing companies or those with lower risk deserve a higher PE ratio, while slower growers or riskier businesses are assigned a lower multiple. This makes context crucial, as simply comparing a company’s PE to the market average can be misleading if it ignores growth or risk differences.
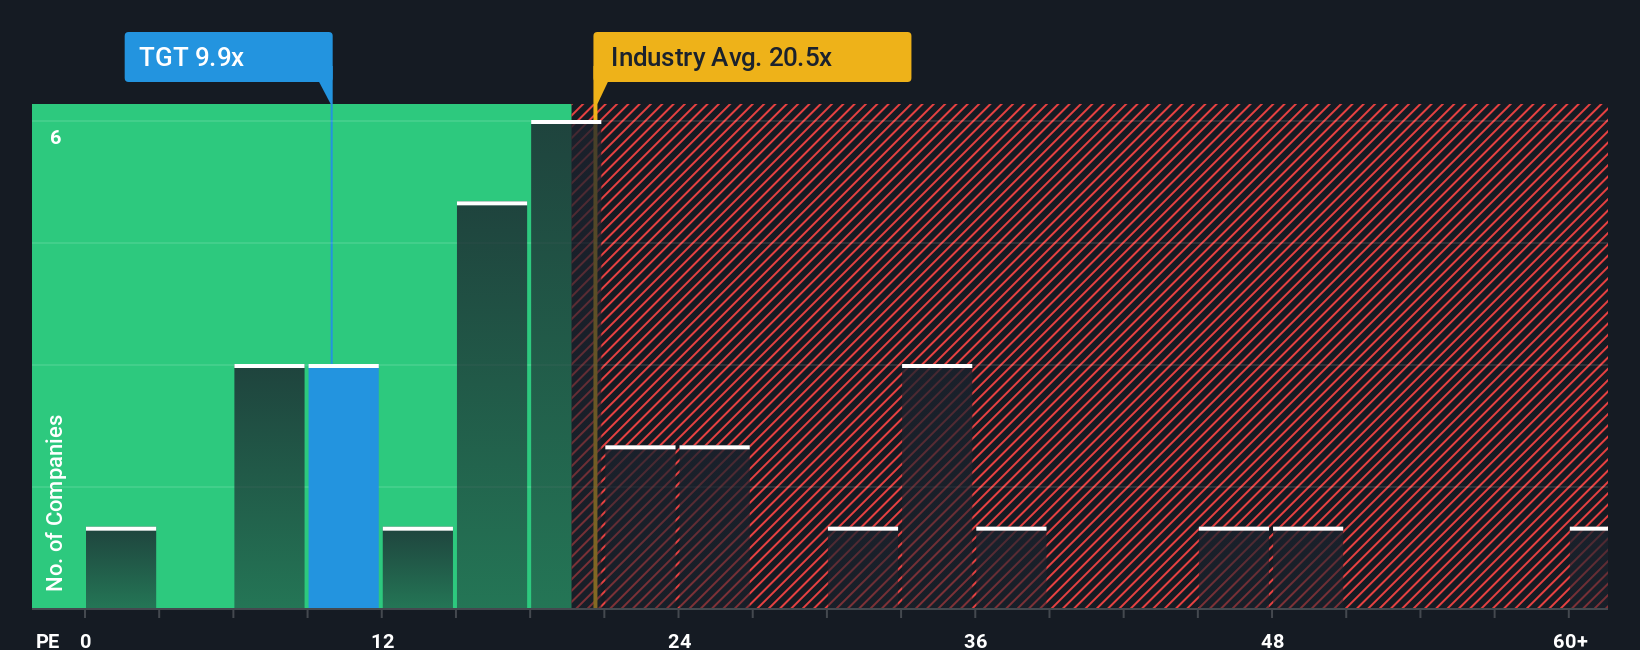
Today, Target trades at a PE of 10.1x. For context, the average PE for its Consumer Retailing industry peers is 21.1x, while the peer group average is a notably higher 28.0x. At first glance, it might seem like Target is a bargain. However, Simply Wall St’s proprietary “Fair Ratio” for Target is 22.8x. Unlike a simple industry or peer comparison, this Fair Ratio factors in Target’s own earnings growth potential, risk profile, profit margins, and company size, making it a more tailored and meaningful benchmark.
Comparing Target’s current PE of 10.1x with the Fair Ratio of 22.8x, Target appears to be significantly undervalued by this metric as well.
Result: UNDERVALUED
Upgrade Your Decision Making: Choose your Target Narrative
Earlier we mentioned that there is an even better way to understand valuation, so let’s introduce you to Narratives. A Narrative is simply your story for a company; the why behind your assumptions about future revenue, profit margins, and fair value. Narratives bridge the gap between numbers and real-life context, linking your perspective on Target’s future to a specific financial forecast, and then connecting that forecast to an estimated fair value.
This approach is both simple and powerful. All you need is your own view about the big drivers of Target’s business, and within Simply Wall St’s Community page, you can build or compare Narratives used by millions of other investors. Narratives help you decide when to buy or sell by showing how your Fair Value estimate (anchored in your assumptions) compares to the current share price, and automatically update as news breaks or fresh financial data comes in.
For example, on Target’s Community page, you’ll see some investors with a bullish Narrative forecasting $4.2 billion in earnings and a $135 price target, while others are more cautious, projecting $3.2 billion in earnings and a price target as low as $82. Narratives make it easy to see how different perspectives lead to different valuation outcomes, and empower you to select the investment story that fits your view.
Do you think there's more to the story for Target? Create your own Narrative to let the Community know!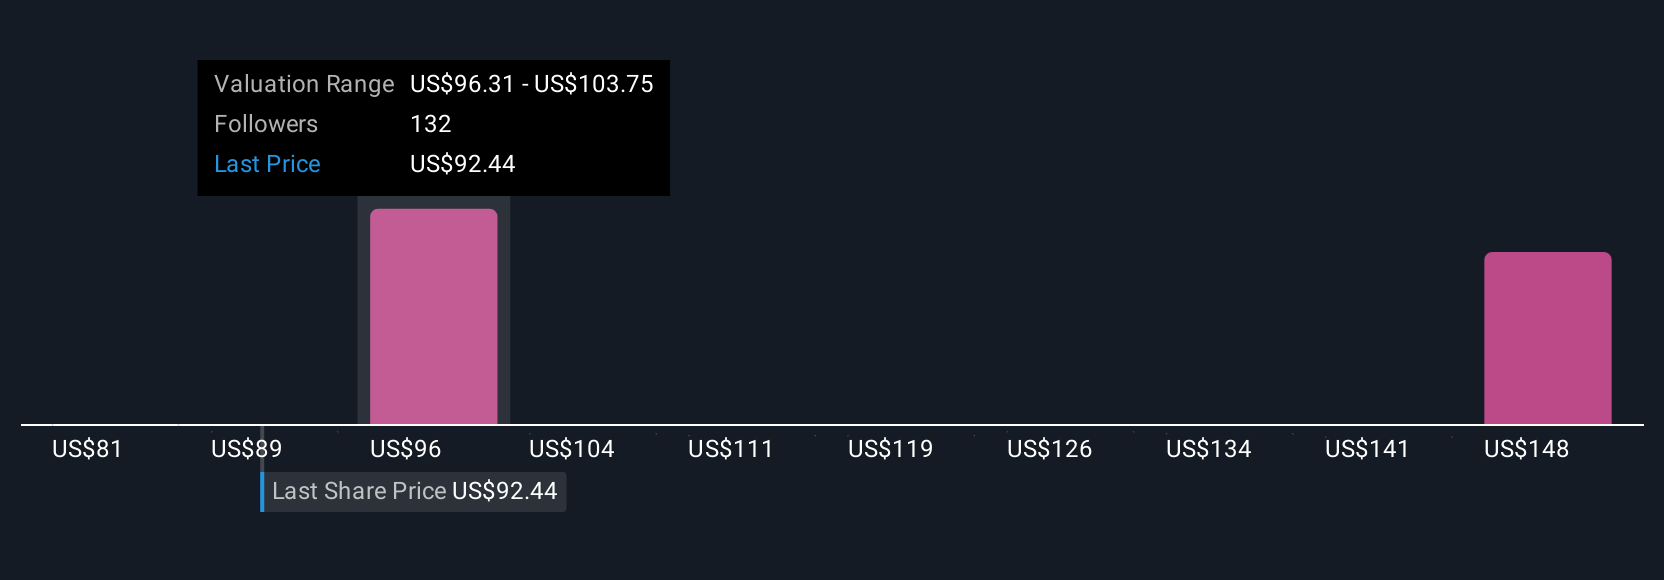
This article by Simply Wall St is general in nature. We provide commentary based on historical data and analyst forecasts only using an unbiased methodology and our articles are not intended to be financial advice. It does not constitute a recommendation to buy or sell any stock, and does not take account of your objectives, or your financial situation. We aim to bring you long-term focused analysis driven by fundamental data. Note that our analysis may not factor in the latest price-sensitive company announcements or qualitative material. Simply Wall St has no position in any stocks mentioned.