
Please use a PC Browser to access Register-Tadawul
Get It
Interactive Brokers (IBKR): Evaluating Valuation After Clients Outperform the S&P 500 on Its Low-Cost Platform
Interactive Brokers Group, Inc. Class A IBKR | 74.39 | +0.55% |
Interactive Brokers Group (IBKR) is back in focus after reporting that both individual and hedge fund clients beat the S&P 500 in 2025. This highlights how its low cost, execution focused platform can shape investor outcomes.
That backdrop has helped the share price to $67.23, with a 1 day share price return of 4.54% and a softer 90 day share price return of minus 3.42%, while the 1 year total shareholder return of 47.15% and 5 year total shareholder return of 295.75% suggest the longer term momentum in the story is still very much intact.
If IBKR’s numbers have you thinking about what else is working in financial markets, it could be a good moment to explore fast growing stocks with high insider ownership.
With client performance strong, accounts still growing and the shares trading about 15% below analyst targets, is Interactive Brokers quietly undervalued at this point, or are investors already paying up for years of future growth?
With Interactive Brokers closing at $67.23 against a narrative fair value near $77.33, the story leans toward upside if its growth path holds.
The introduction of new products and enhancements, such as the strengthened ATS with new liquidity providers and order types, enhancements to the IBKR Financial Advisor Portal, and the launch of securities lending for Swedish stocks, suggests potential for increased trading activity and higher commission revenue. Record client credit balances at $107.1 billion, up 36% over last year, indicate a strong trust in the platform and substantial funds availability for trading, possibly leading to higher net interest income from margin loans as clients leverage their positions.
Want to see the engine behind that valuation gap? This narrative leans on steady growth, rising margins, and a future profit multiple usually reserved for market darlings. Curious which specific earnings and revenue trajectories are doing the heavy lifting? The full story reveals the precise assumptions that turn today’s price into tomorrow’s potential.
Result: Fair Value of $77.33 (UNDERVALUED)
However, this upside case still relies on supportive rates and healthy trading volumes, both of which could quickly reverse if markets or central banks shift course.
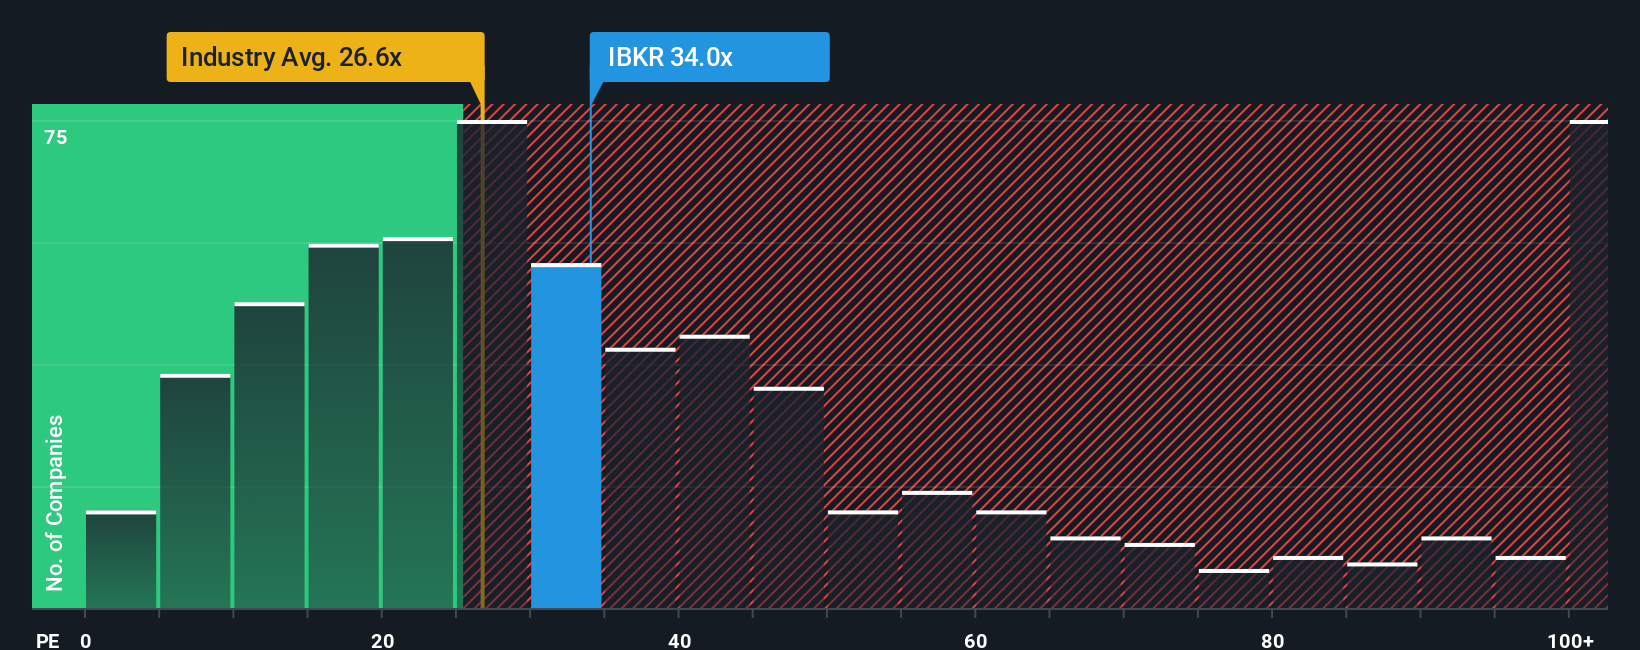
That upbeat narrative of fair value contrasts with a harsher view from earnings-based valuation. At 32.7 times earnings, Interactive Brokers trades well above peers at 26.8 times, the broader Capital Markets industry at 25.6 times, and even its own fair ratio of 21.6 times. This raises the risk that expectations may already be fully priced in.
If this view does not quite fit your outlook, or you would rather dig into the numbers yourself, you can build a custom narrative in just a few minutes, starting with Do it your way.
A great starting point for your Interactive Brokers Group research is our analysis highlighting 2 key rewards and 1 important warning sign that could impact your investment decision.
Right now is the moment to expand your watchlist, because the most compelling opportunities rarely wait around for investors who only look at one stock.
This article by Simply Wall St is general in nature. We provide commentary based on historical data and analyst forecasts only using an unbiased methodology and our articles are not intended to be financial advice. It does not constitute a recommendation to buy or sell any stock, and does not take account of your objectives, or your financial situation. We aim to bring you long-term focused analysis driven by fundamental data. Note that our analysis may not factor in the latest price-sensitive company announcements or qualitative material. Simply Wall St has no position in any stocks mentioned.
