Is ACM Research (ACMR) Pricing Reflect Semiconductor Equipment Hype Or Long Term Potential
ACM Research, Inc. Class A ACMR | 0.00 |
- If you are wondering whether ACM Research's share price still lines up with its fundamentals, this article walks through what the current valuation metrics are actually telling you.
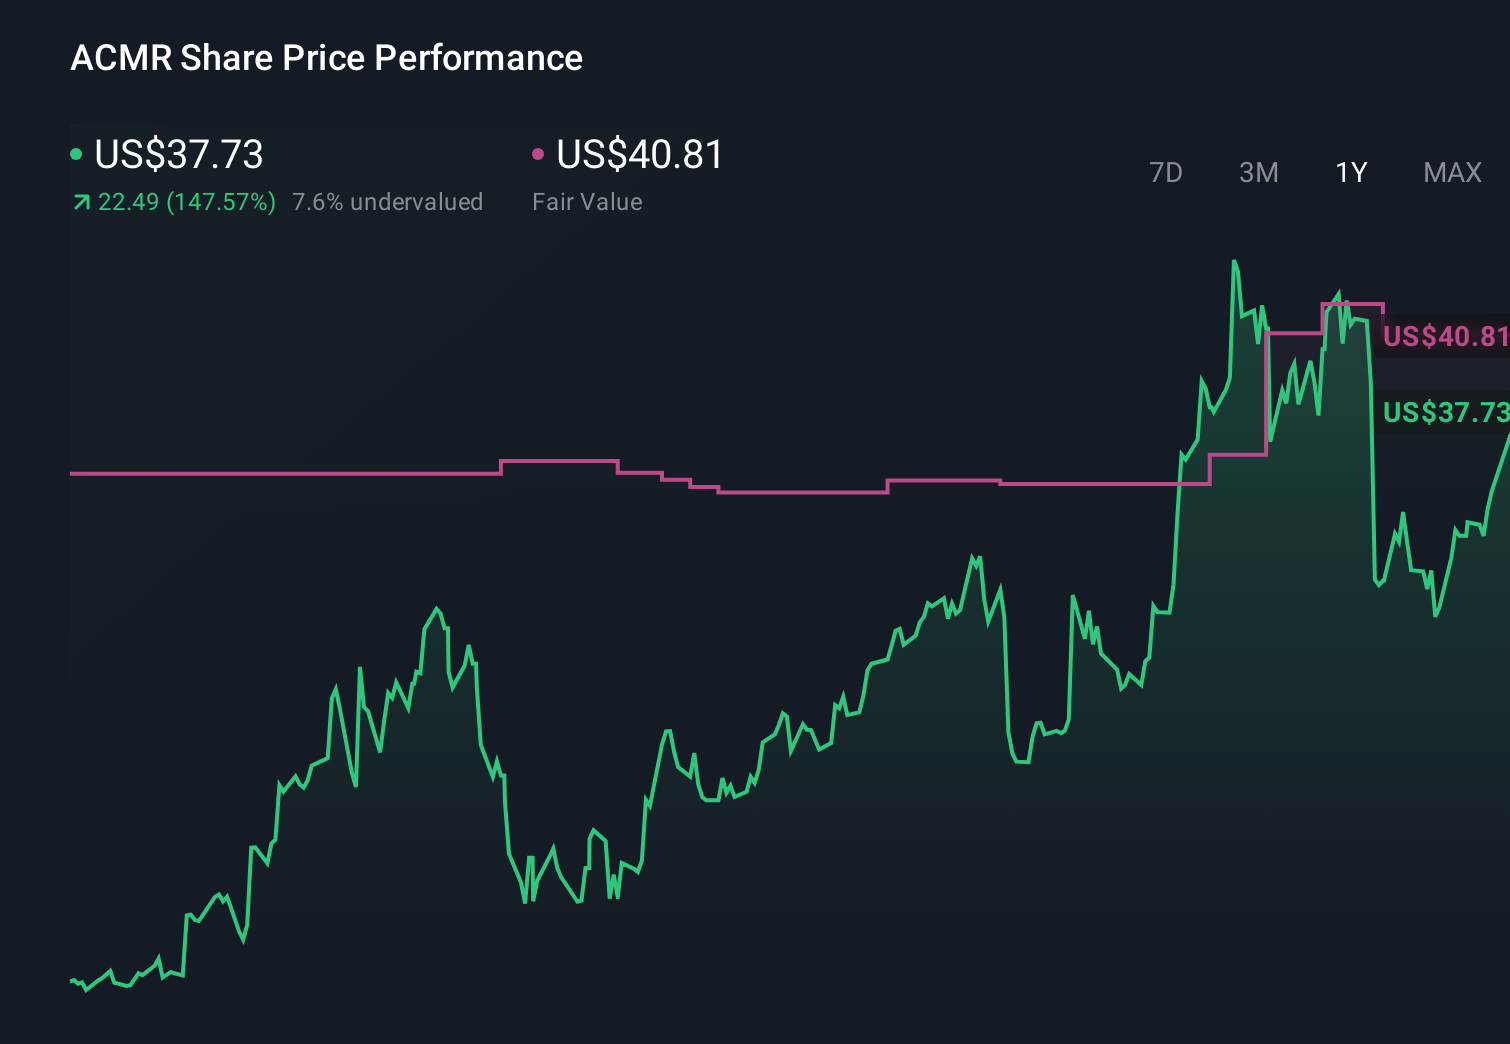
- The stock last closed at US$64.10, with returns of 17.9% over 7 days, 24.9% over 30 days, 42.8% year to date, 176.3% over 1 year and 391.2% over 3 years, which naturally raises questions about how the recent price compares with estimated fair value.
- Recent news around ACM Research has focused on its role in semiconductor equipment and ongoing attention from investors who track that segment of the market, which helps explain why the share price has been active. Coverage has often centered on how the business is positioned within its niche and what that could mean for sentiment around the stock.
- On Simply Wall St's valuation checks, ACM Research currently has a value score of 3 out of 6, so we will look at how different valuation methods arrive at that result and then finish with a way to interpret valuation that goes beyond just the numbers.
Approach 1: ACM Research Discounted Cash Flow (DCF) Analysis
A Discounted Cash Flow, or DCF, model estimates what a company might be worth by projecting its future cash flows and then discounting those back to today’s dollars. It is essentially asking what all those future cash flows are worth right now.
For ACM Research, the model used is a 2 Stage Free Cash Flow to Equity approach based on cash flow projections. The latest twelve month free cash flow is a loss of $66.2 million. Looking ahead, analyst and extrapolated estimates have free cash flow moving to $219.5 million in 2030, with intermediate annual projections between 2026 and 2035 supplied by a mix of analyst inputs and Simply Wall St estimates.
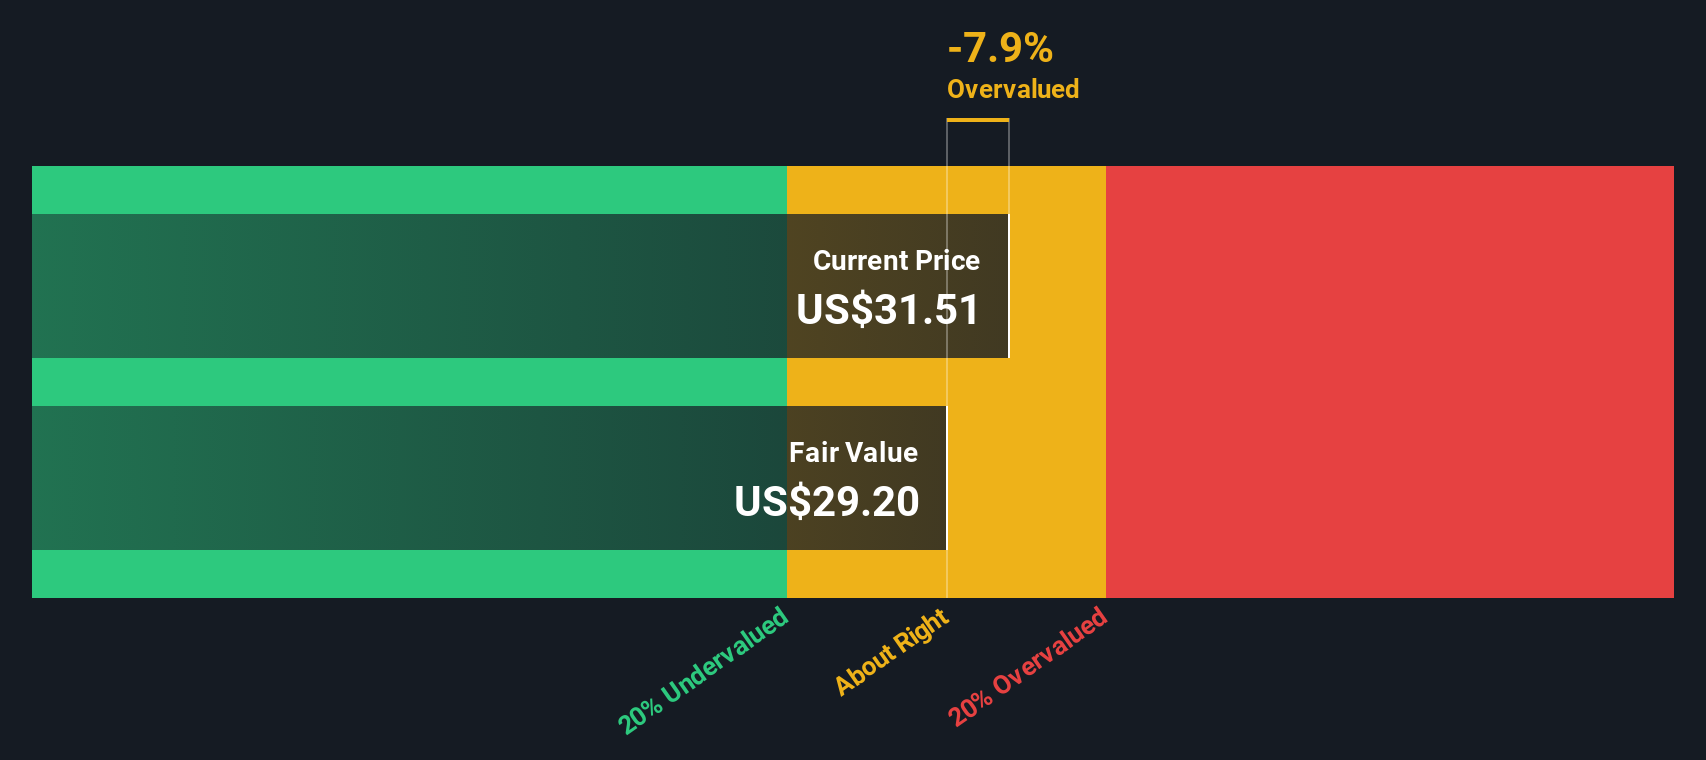
When all those projected cash flows are discounted back, the DCF model arrives at an estimated intrinsic value of about $49.86 per share. Compared with the recent share price of $64.10, this implies the stock is about 28.6% above that DCF estimate, which suggests ACM Research may be trading on the expensive side based on this method alone.
Result: OVERVALUED
Our Discounted Cash Flow (DCF) analysis suggests ACM Research may be overvalued by 28.6%. Discover 55 high quality undervalued stocks or create your own screener to find better value opportunities.
Approach 2: ACM Research Price vs Earnings
For profitable companies, the P/E ratio is a useful way to link what you pay for the stock to the earnings the business is currently producing. It effectively tells you how many dollars investors are willing to pay today for each dollar of earnings. Higher expected growth or lower perceived risk can justify a higher P/E, while slower growth or higher risk usually points to a lower, more conservative P/E being considered normal.
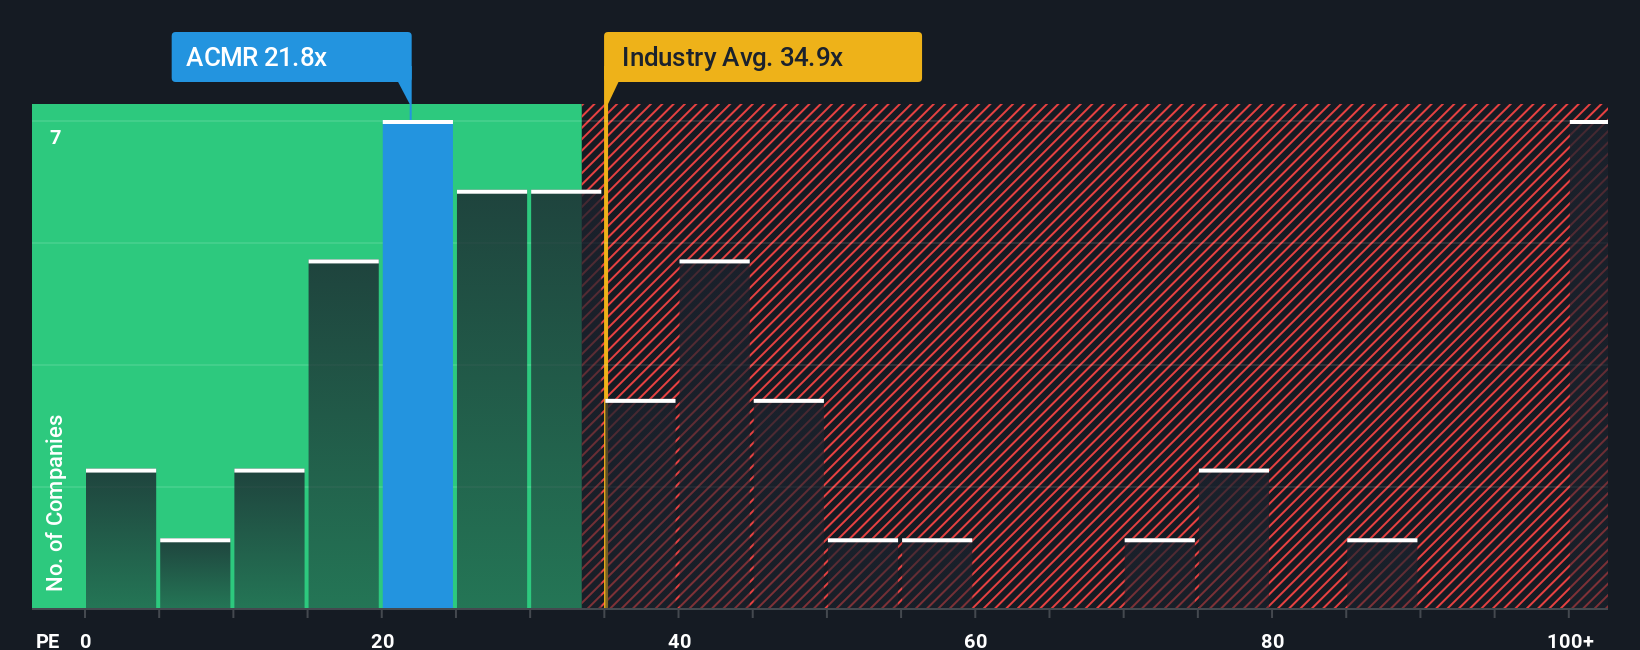
ACM Research currently trades on a P/E of 35.5x. That sits below the Semiconductor industry average P/E of 43.2x and also below the peer group average of 79.7x, so on simple comparisons the stock is on a lower multiple than those benchmarks. Simply Wall St also calculates a proprietary “Fair Ratio” of 40.3x for ACM Research, which reflects factors such as its earnings growth profile, profit margins, industry, market capitalization and company specific risks.
This Fair Ratio can be more informative than a straight peer or industry comparison, because it adjusts for the company’s own characteristics rather than assuming all semiconductor stocks should trade on the same multiple. Setting the current P/E of 35.5x against the Fair Ratio of 40.3x suggests the shares are trading below that modeled level.
Result: UNDERVALUED
P/E ratios tell one story, but what if the real opportunity lies elsewhere? Start investing in legacies, not executives. Discover our 23 top founder-led companies.
Upgrade Your Decision Making: Choose your ACM Research Narrative
Earlier we mentioned that there is an even better way to understand valuation, so let us introduce you to Narratives, a simple tool on Simply Wall St's Community page that lets you write the story you believe about a company like ACM Research, translate that story into explicit forecasts for revenue, earnings and margins, and then see the fair value that falls out of those assumptions. All of this updates in real time as new news or earnings arrive, so you can compare your Fair Value with the current price and decide whether ACM looks more like the higher fair value case around US$62.70 or the lower one near US$36.00 for your own portfolio decisions.
Do you think there's more to the story for ACM Research? Head over to our Community to see what others are saying!
This article by Simply Wall St is general in nature. We provide commentary based on historical data and analyst forecasts only using an unbiased methodology and our articles are not intended to be financial advice. It does not constitute a recommendation to buy or sell any stock, and does not take account of your objectives, or your financial situation. We aim to bring you long-term focused analysis driven by fundamental data. Note that our analysis may not factor in the latest price-sensitive company announcements or qualitative material. Simply Wall St has no position in any stocks mentioned.