
Please use a PC Browser to access Register-Tadawul
Get It
Is Amphastar Pharmaceuticals (AMPH) Attractively Priced After Recent Share Price Weakness?
Amphastar Pharmaceuticals Inc AMPH | 28.53 | -0.04% |
A Discounted Cash Flow, or DCF, model estimates what a company could be worth today by projecting its future cash flows and discounting them back to a present value using a required rate of return.
For Amphastar Pharmaceuticals, the model used is a 2 Stage Free Cash Flow to Equity approach based on cash flow projections. The latest twelve month free cash flow is about $110.7 million. Analyst inputs and extrapolated figures are used to extend that view, with Simply Wall St projecting free cash flow of $186.0 million in 2030, based on a series of annual estimates and then on modelled extensions beyond the usual 5 year analyst window.
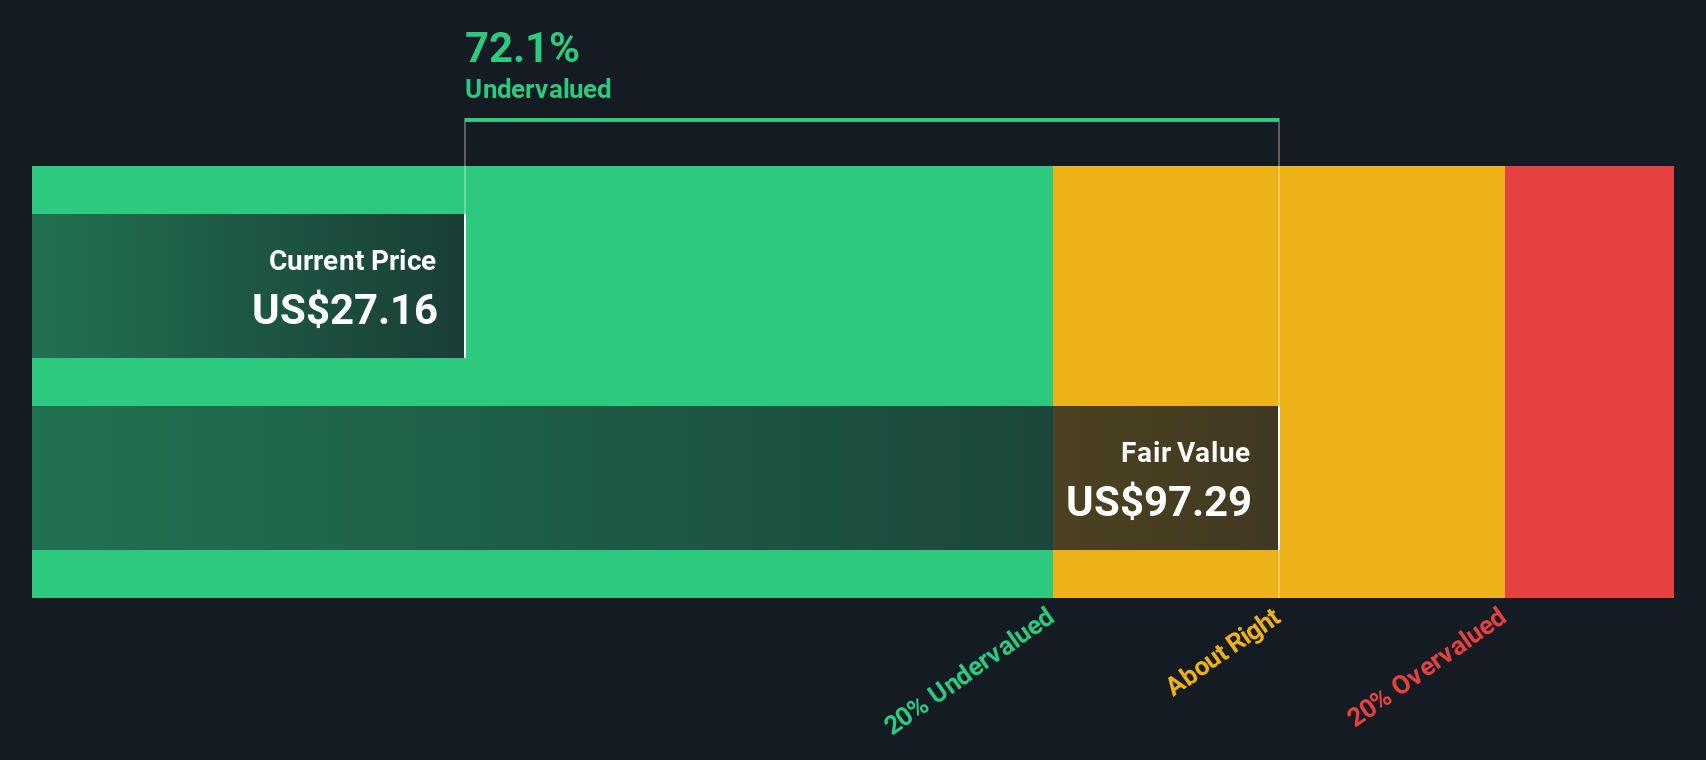
Bringing all those discounted cash flows together gives an estimated intrinsic value of US$91.66 per share. Compared with the recent share price of US$27.74, the DCF output indicates Amphastar Pharmaceuticals is trading at a 69.7% discount to this estimate. This highlights a wide gap between the current price and this particular valuation model.
Result: UNDERVALUED
Our Discounted Cash Flow (DCF) analysis suggests Amphastar Pharmaceuticals is undervalued by 69.7%. Track this in your watchlist or portfolio, or discover 872 more undervalued stocks based on cash flows.
For a profitable company, the P/E ratio is a useful way to think about what you are paying for each dollar of earnings. It links the share price directly to the business’s ability to generate profit, which is usually the main long term driver of returns.
What counts as a “normal” or “fair” P/E depends on what investors expect for future growth and how much risk they see in those earnings. Higher expected growth or lower perceived risk can justify a higher P/E, while lower growth or higher risk usually points to a lower multiple.
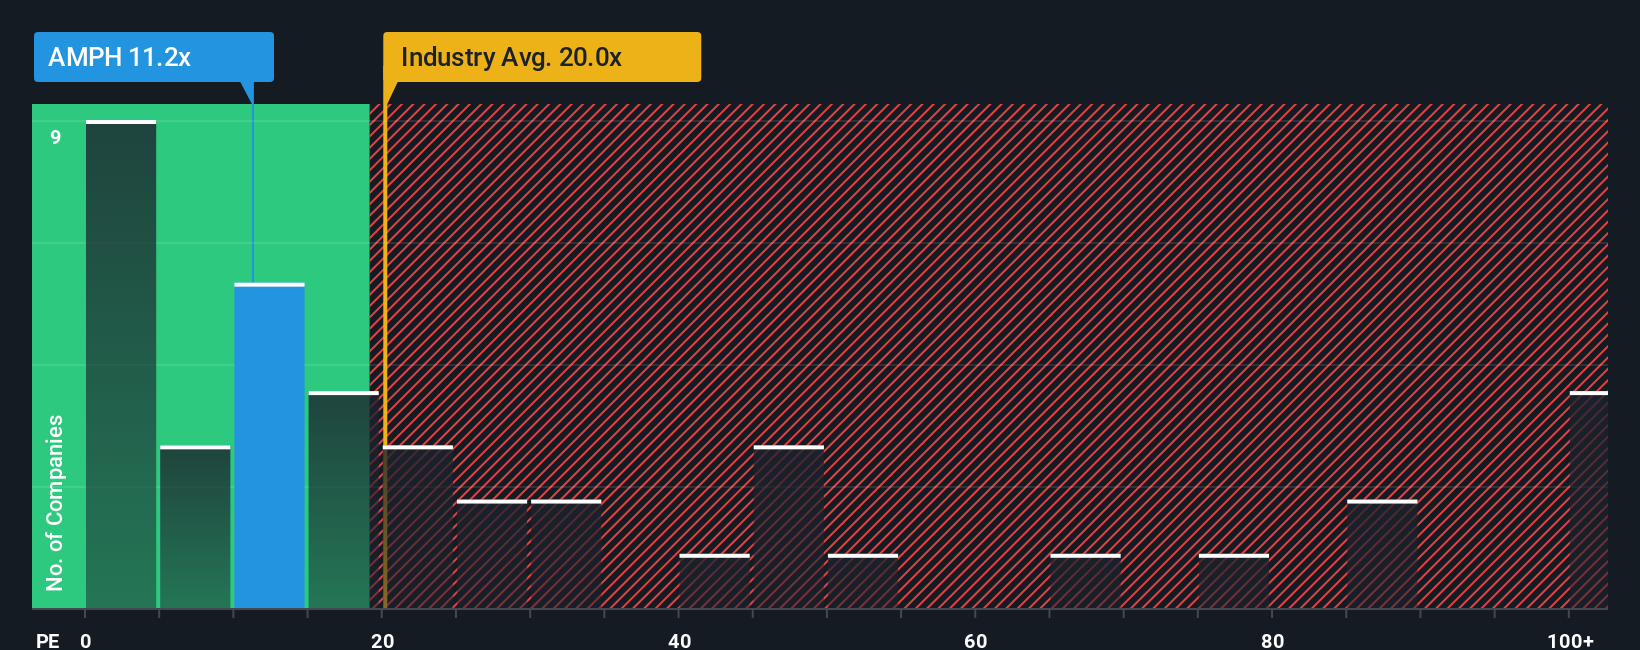
Amphastar Pharmaceuticals currently trades on a P/E of 11.4x. That sits below the Pharmaceuticals industry average of 19.7x and also below the peer group average of 33.8x. Simply Wall St’s Fair Ratio for Amphastar Pharmaceuticals is 14.7x. This is a proprietary estimate of what the P/E might be given the company’s earnings growth profile, profit margins, industry, market cap and risk characteristics. As a result, it aims to be more tailored than a simple comparison with peers or the sector.
With the current P/E of 11.4x versus a Fair Ratio of 14.7x, Amphastar Pharmaceuticals screens as undervalued on this metric.
Result: UNDERVALUED
P/E ratios tell one story, but what if the real opportunity lies elsewhere? Discover 1443 companies where insiders are betting big on explosive growth.
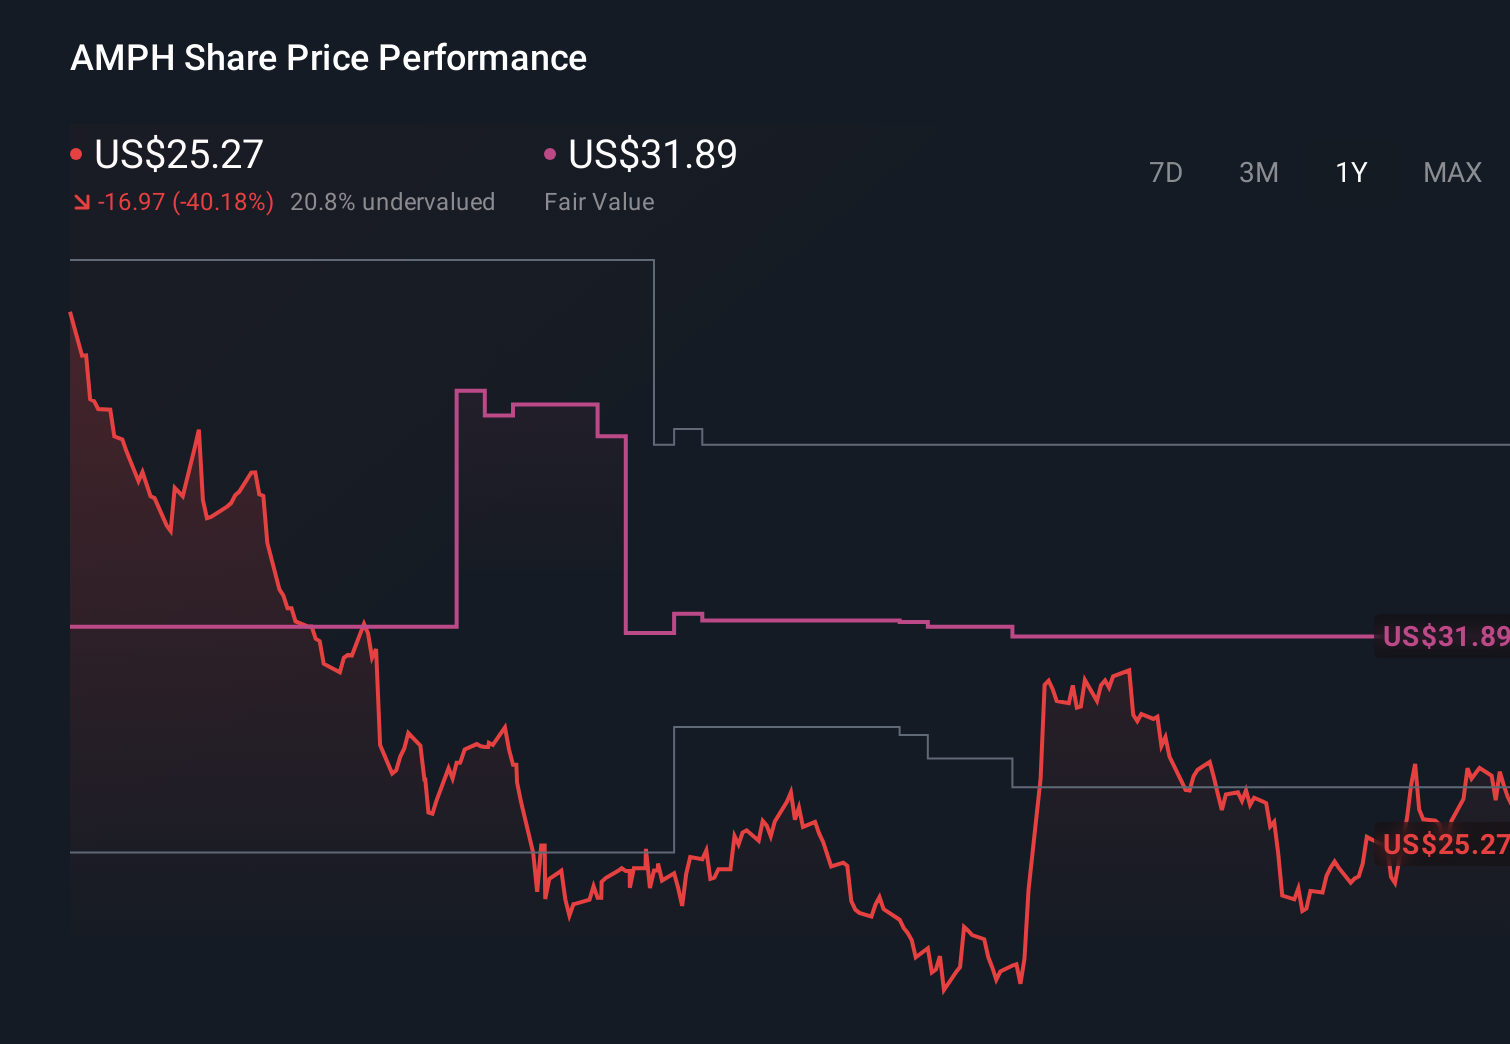
Earlier we mentioned that there is an even better way to understand valuation, so let us introduce you to Narratives. These are simply your own story about Amphastar Pharmaceuticals that ties your assumptions about future revenue, earnings, margins and a fair value to a clear forecast. You can then compare that Fair Value with the current price to help you decide whether the stock looks attractive or not. Narratives automatically refresh when new information such as earnings or news arrives. Different investors on Simply Wall St’s Community page, where millions of investors share their views, may build very different Narratives from the same data. For example, one investor might see the higher analyst target of US$38.00 as reasonable if they expect Amphastar to meet the consensus view of US$830.2 million in revenue and US$142.5 million in earnings by 2028 on an 11.5x P/E. Another might lean closer to the US$25.00 end of the range if they focus more on risks such as pricing pressure and competition.
Do you think there's more to the story for Amphastar Pharmaceuticals? Head over to our Community to see what others are saying!
This article by Simply Wall St is general in nature. We provide commentary based on historical data and analyst forecasts only using an unbiased methodology and our articles are not intended to be financial advice. It does not constitute a recommendation to buy or sell any stock, and does not take account of your objectives, or your financial situation. We aim to bring you long-term focused analysis driven by fundamental data. Note that our analysis may not factor in the latest price-sensitive company announcements or qualitative material. Simply Wall St has no position in any stocks mentioned.
