Is Berkshire Hathaway (BRK.B) Offering A Compelling Opportunity After Recent Flat Share Performance?
Berkshire Hathaway Inc. Class B BRK.B | 479.75 479.29 | +0.35% -0.10% Post |
- If you have ever wondered whether Berkshire Hathaway is fairly priced or still offering value, this breakdown is designed to give you a clear, no nonsense view of what you are paying for each share.
- The Class B stock recently closed at US$499.10, with returns of 0.5% over the last week, roughly flat at a 0.1% decline over the past month, and 0.5% year to date. The 1 year, 3 year, and 5 year returns sit at 12.8%, 57.1%, and 113.8% respectively.
- Recent attention on Berkshire has continued to focus on its role as a broad holding company, with investors watching how its collection of businesses and large equity portfolio influence the share price. At the same time, coverage has highlighted Berkshire's status as a reference point for long term, diversified exposure, which helps frame how the current price is being interpreted.
- Berkshire currently holds a valuation score of 4/6, reflecting that it screens as undervalued on four of six checks. Next we will walk through how different valuation approaches arrive at that view, before finishing with a way to look beyond the numbers for an even richer sense of value.
Approach 1: Berkshire Hathaway Excess Returns Analysis
The Excess Returns model asks a simple question: is Berkshire earning more on its equity than investors require for the risk they are taking, and if so, how much is that extra return worth per share today?
For Berkshire, the starting point is a Book Value of $485,274.36 per share and an Average Return on Equity of 12.85%. That translates into a Stable EPS estimate of $68,253.81 per share, based on the median return on equity from the past 5 years. Against a Cost of Equity of $40,320.64 per share, the model calculates an Excess Return of $27,933.17 per share.
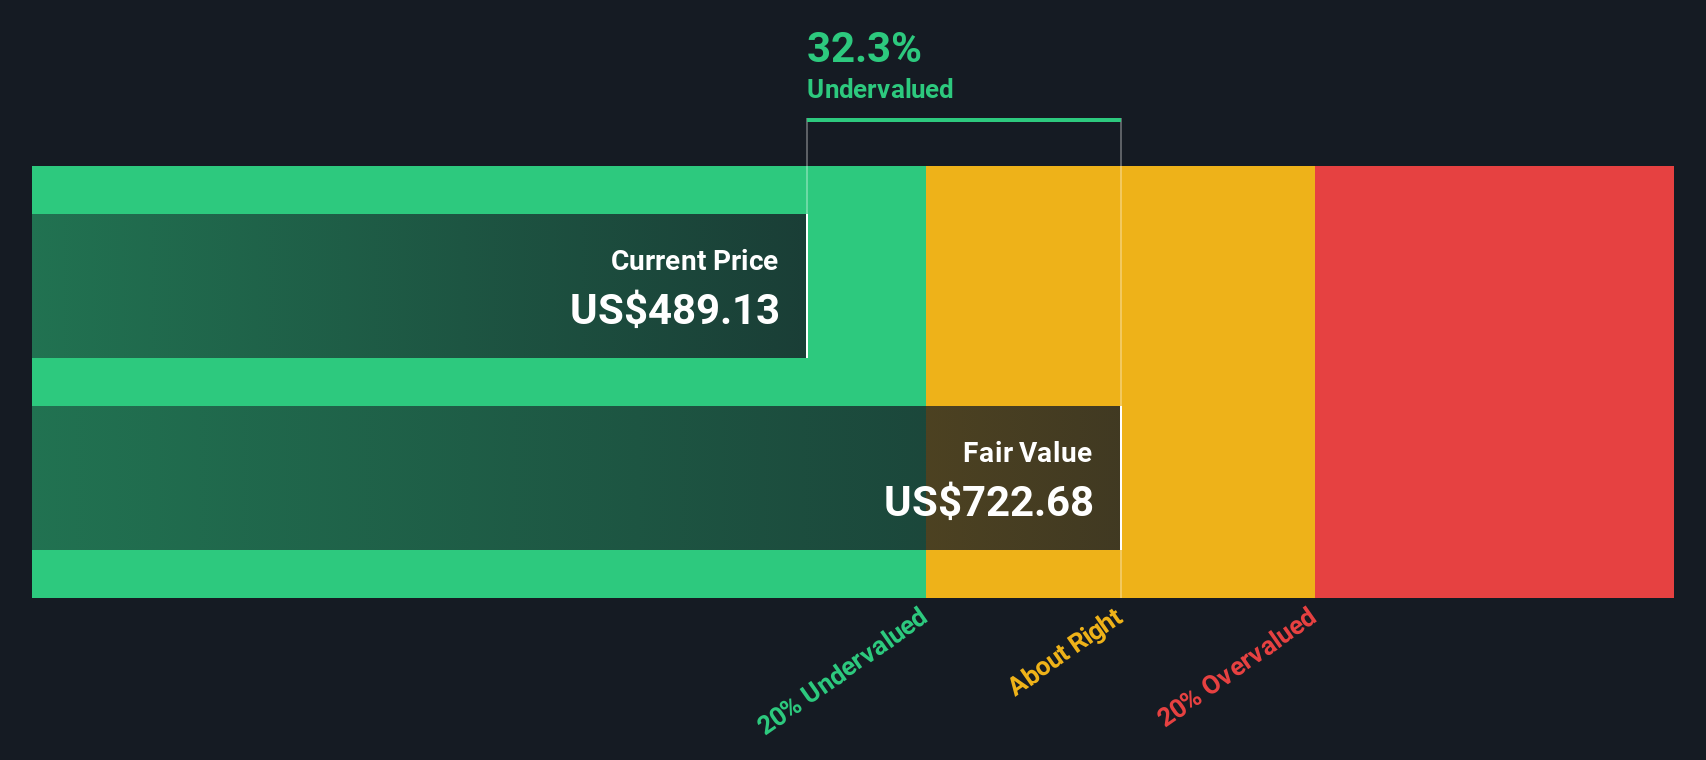
The analysis then projects a Stable Book Value of $531,325.31 per share, using weighted future book value estimates from two analysts, and capitalizes those excess returns to arrive at an intrinsic value of about $785.04 per share. Compared with the recent Class B price of US$499.10, this suggests the stock is around 36.4% undervalued according to this framework.
Result: UNDERVALUED
Our Excess Returns analysis suggests Berkshire Hathaway is undervalued by 36.4%. Track this in your watchlist or portfolio, or discover 882 more undervalued stocks based on cash flows.
Approach 2: Berkshire Hathaway Price vs Earnings
For a profitable company like Berkshire Hathaway, the P/E ratio is a useful way to link what you pay for each share to the earnings the business is generating today. It gives you a simple “price tag per dollar of earnings” that many investors find intuitive.
What counts as a normal or fair P/E depends on how the market views a company’s growth prospects and risk. Higher expected growth or lower perceived risk can support a higher P/E, while slower growth or higher uncertainty usually points to a lower one.
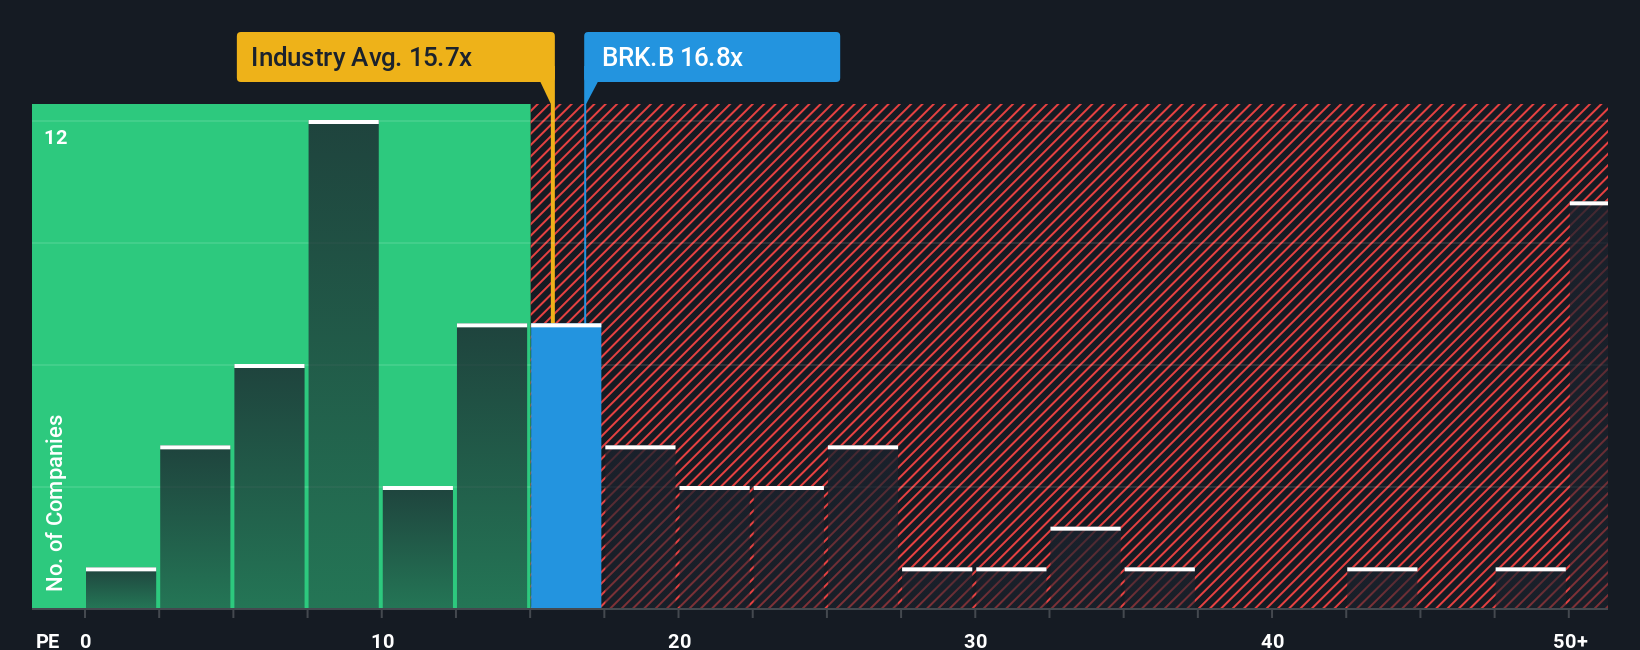
Berkshire is currently trading on a P/E of 15.95x. That sits close to the Diversified Financial industry average of 14.99x and below the peer group average of 26.91x. Simply Wall St’s Fair Ratio for Berkshire is 18.70x. This Fair Ratio is a proprietary estimate of the P/E you might expect given Berkshire’s earnings profile, industry, profit margins, market cap, and risk factors. In other words, it goes further than a simple comparison with peers or the sector.
With the Fair Ratio above the current 15.95x, this framework indicates that Berkshire’s P/E is pointing to the shares trading below that estimated fair range.
Result: UNDERVALUED
P/E ratios tell one story, but what if the real opportunity lies elsewhere? Discover 1444 companies where insiders are betting big on explosive growth.
Upgrade Your Decision Making: Choose your Berkshire Hathaway Narrative
Earlier we mentioned that there is an even better way to understand valuation, so let us introduce you to Narratives, which are simply your story about a company, tied directly to your own fair value, revenue, earnings, and margin assumptions.
A Narrative connects what you believe about Berkshire’s business to a financial forecast and then to a clear estimate of fair value, instead of leaving those numbers to sit on a page without context.
On Simply Wall St’s Community page, used by millions of investors, you can create or review Narratives that compare an investor’s Fair Value to the current Price. This can help you decide whether you see Berkshire as priced attractively, fully priced, or expensive based on your own view.
These Narratives update automatically when new information comes in. If Berkshire reports earnings or appears in the news, the forecast and the gap between Fair Value and Price refresh to reflect that change.
For Berkshire, one investor might focus on its role as a broad holding company and assign a higher fair value. Another might be more cautious about future returns from its equity portfolio and settle on a much lower fair value, even using the same publicly available data.
Do you think there's more to the story for Berkshire Hathaway? Head over to our Community to see what others are saying!

This article by Simply Wall St is general in nature. We provide commentary based on historical data and analyst forecasts only using an unbiased methodology and our articles are not intended to be financial advice. It does not constitute a recommendation to buy or sell any stock, and does not take account of your objectives, or your financial situation. We aim to bring you long-term focused analysis driven by fundamental data. Note that our analysis may not factor in the latest price-sensitive company announcements or qualitative material. Simply Wall St has no position in any stocks mentioned.