Is Bio-Rad Laboratories (BIO) Starting To Look Attractive After Prolonged Share Price Weakness?
Bio-Rad Laboratories, Inc. Class A BIO | 0.00 |
- Wondering if Bio-Rad Laboratories at around US$305 a share is starting to look like value, or if the recent price action is a warning sign you should not ignore?
- The stock has been volatile, with a 5.2% decline over the last week, a 1.4% gain over the past month, and longer term returns of a 13.4% decline over 1 year, 35.9% decline over 3 years, and 46.1% decline over 5 years.
- These moves sit against a backdrop of ongoing interest in life sciences and diagnostics. In this space, investors often reassess companies like Bio-Rad as market conditions and sector sentiment change. Recent attention has focused less on short term headlines and more on how the stock is priced relative to its fundamentals and peers.
- On our checklist-based valuation framework, Bio-Rad scores 5 out of 6 for being undervalued. We will unpack this using several common valuation methods before finishing with a broader way to think about what that score really means for you.
Approach 1: Bio-Rad Laboratories Discounted Cash Flow (DCF) Analysis
A Discounted Cash Flow, or DCF, model takes the cash Bio-Rad Laboratories is expected to generate in the future and discounts those cash flows back to what they might be worth in today’s dollars.
For Bio-Rad, the model uses last twelve month free cash flow of about $330.8 million and a 2 Stage Free Cash Flow to Equity approach. Analysts supply near term estimates, such as projected free cash flow of $419.54 million for 2023. Simply Wall St then extrapolates further out, including ten year projections that reach $713.75 million in 2035, with each year discounted back to today.
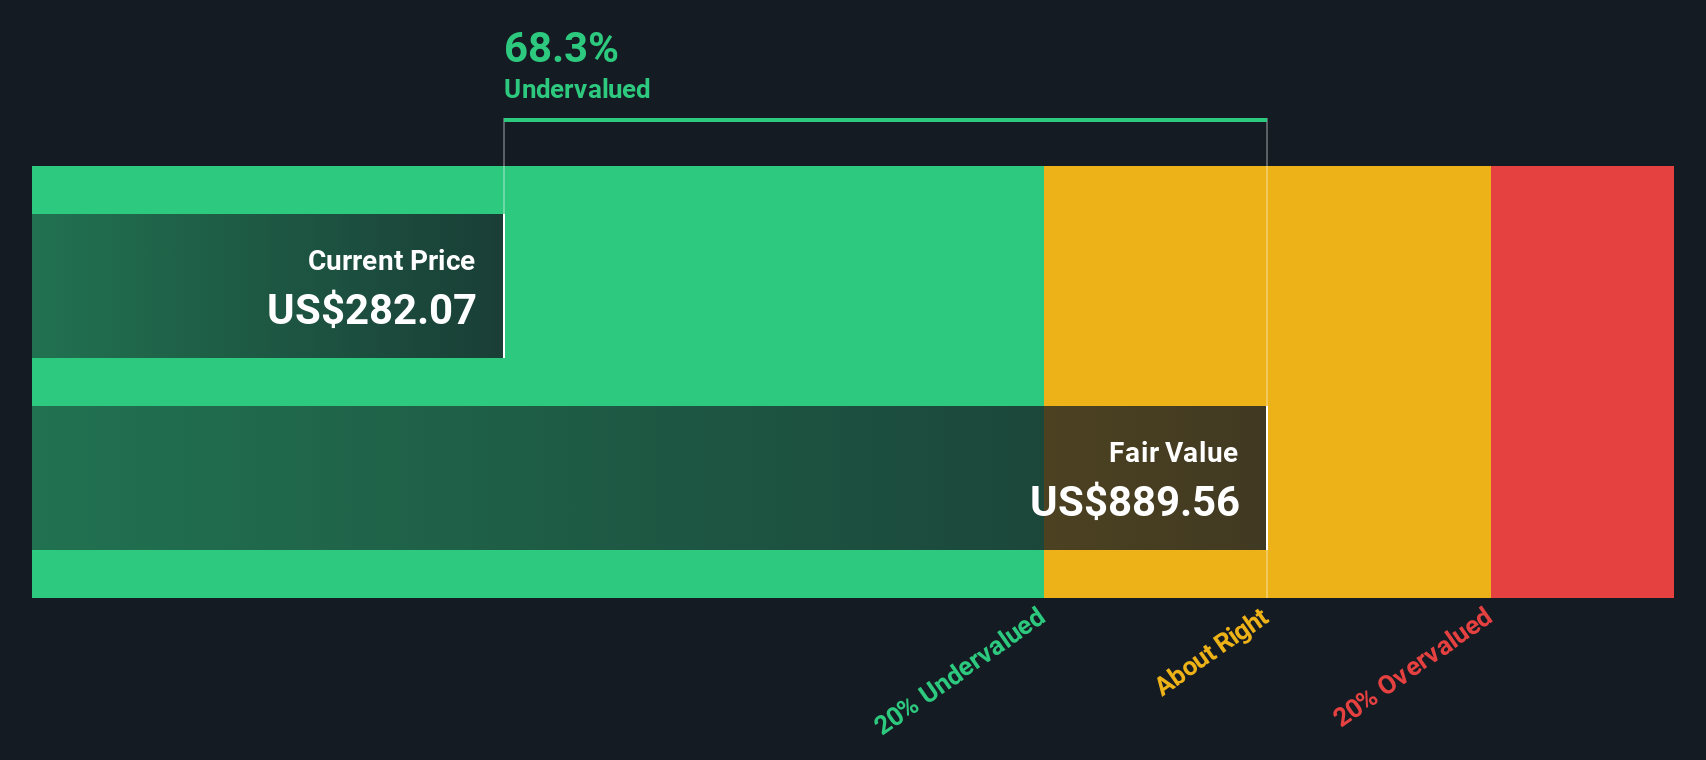
When all those discounted cash flows are added together, the model produces an estimated intrinsic value of about $392.15 per share. Compared with a recent share price around $305, this implies the stock is roughly 22.2% below that DCF value, which indicates Bio-Rad is trading at a discount based on these cash flow assumptions.
Result: UNDERVALUED
Our Discounted Cash Flow (DCF) analysis suggests Bio-Rad Laboratories is undervalued by 22.2%. Track this in your watchlist or portfolio, or discover 878 more undervalued stocks based on cash flows.
Approach 2: Bio-Rad Laboratories Price vs Sales
For companies where earnings can be harder to interpret, the P/S ratio is often a useful cross check because it ties the share price to the revenue the business brings in, which can be more stable than profits from year to year.
What counts as a “normal” or “fair” P/S ratio usually reflects how quickly investors expect revenue to grow and how much risk they see in those cash flows. Higher growth and lower risk often support higher multiples, while slower growth or higher risk tend to point to lower ones.
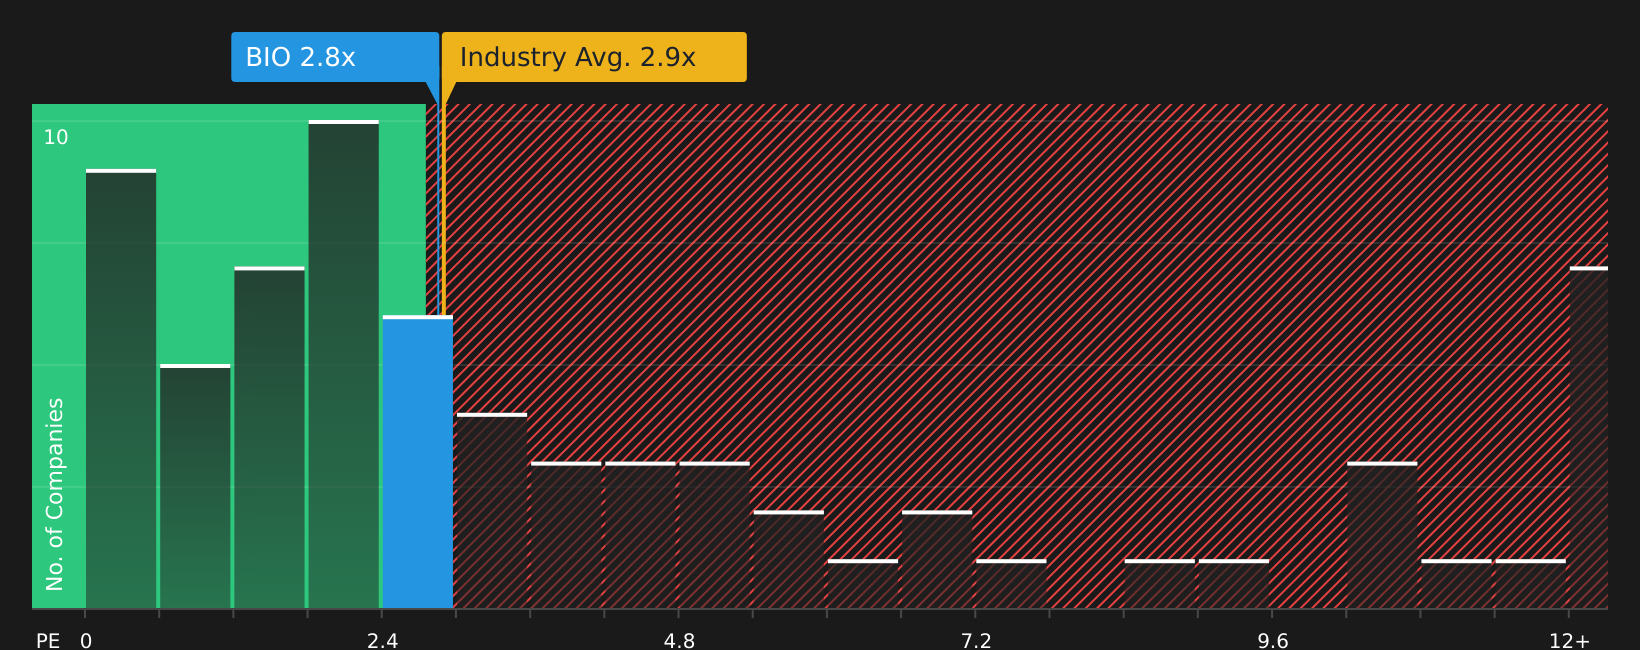
Bio-Rad currently trades on a P/S of 3.22x. That sits below the Life Sciences industry average of 3.73x and below the peer group average of 5.69x. Simply Wall St’s “Fair Ratio” for Bio-Rad is 3.37x, which is a proprietary estimate of the multiple that might be appropriate given factors such as its growth profile, profit margins, industry, market cap and specific risks.
This Fair Ratio can be more tailored than a simple comparison with industry or peers, because it adjusts for the company’s own characteristics rather than assuming all Life Sciences stocks deserve the same multiple. Bio-Rad’s current 3.22x P/S is slightly under the 3.37x Fair Ratio, which indicates that the shares are trading at a modest discount on this metric.
Result: UNDERVALUED on this metric
P/S ratios tell one story, but what if the real opportunity lies elsewhere? Discover 1428 companies where insiders are betting big on explosive growth.
Upgrade Your Decision Making: Choose your Bio-Rad Laboratories Narrative
Earlier we mentioned that there is an even better way to understand valuation, so let us introduce you to Narratives, which are simply your story about Bio-Rad Laboratories tied directly to numbers like your fair value, expected revenue, earnings and margins, so that the company’s story connects to a forecast and then to a price you think is reasonable.
On Simply Wall St’s Community page, used by millions of investors, Narratives are an easy tool where you set your assumptions, see the fair value that falls out of those inputs, compare it with today’s market price to help you decide whether the stock looks appealing or expensive, and then watch that view update automatically when new information such as news or earnings is added to the platform.
For example, one Bio-Rad Narrative might assume relatively conservative growth and a lower fair value. Another might assume stronger growth and a higher fair value. This shows how two investors looking at the same stock price can reach very different conclusions about what to do next.
Do you think there's more to the story for Bio-Rad Laboratories? Head over to our Community to see what others are saying!

This article by Simply Wall St is general in nature. We provide commentary based on historical data and analyst forecasts only using an unbiased methodology and our articles are not intended to be financial advice. It does not constitute a recommendation to buy or sell any stock, and does not take account of your objectives, or your financial situation. We aim to bring you long-term focused analysis driven by fundamental data. Note that our analysis may not factor in the latest price-sensitive company announcements or qualitative material. Simply Wall St has no position in any stocks mentioned.