Is Cadence Design Systems Stock Justified After AI-Driven Chip Design Push?
Cadence Design Systems, Inc. CDNS | 0.00 |
If you are sizing up your next move with Cadence Design Systems, you are not alone. In a market brimming with opportunity and uncertainty, CDNS has certainly caught investors’ attention. The stock closed at $337.27 most recently, with a bit of a rollercoaster behind it: up 4.0% over the past week, but down 7.9% for the month. Zoom out to the past year and the returns get even more impressive, climbing 34.2% over 12 months and registering a massive 206.0% gain over the past five years. With a year-to-date gain of 13.3%, long-term holders might feel vindicated, but fresh buyers still have questions.
Recent headlines have spotlighted Cadence’s push into AI-driven chip design and partnerships with semiconductor leaders, fueling optimism about the company’s potential to shape the next phase of tech innovation. Such moves have nudged investor sentiment and may explain some of the stock’s resilience in the face of broader market jitters. Still, not everything in the news translates directly into price swings; the market’s expectations about future growth and risk often run deeper.
But with all this action, is Cadence Design Systems actually trading below its fair value? Our current valuation score for the stock lands at 0 out of 6, suggesting there is little support from the standard undervaluation checks. Next, we will walk through those common valuation lenses. And, if you are seeking something more insightful than numbers alone, stay tuned as we end this article by exploring a perspective that puts all these metrics into real context.
Cadence Design Systems scores just 0/6 on our valuation checks. See what other red flags we found in the full valuation breakdown.
Approach 1: Cadence Design Systems Discounted Cash Flow (DCF) Analysis
The Discounted Cash Flow (DCF) model projects a company’s expected future cash flows and discounts them back to their present value, providing an estimate of what the business is worth today. This helps investors gauge if the current stock price reflects a reasonable valuation based on those projected cash streams.
For Cadence Design Systems, the most recent Free Cash Flow reported was $1.57 billion. Analysts have provided cash flow projections for several years out, with Free Cash Flow estimated to grow to $2.54 billion by 2029. After analyst estimates end in five years, further growth forecasts are extrapolated using internal models. All numbers reflect cash flows in US dollars.
The DCF calculation for Cadence yields an intrinsic value of $168.64 per share. With the current share price at $337.27, this implies the stock trades roughly 100% above its estimated fair value. In short, the DCF suggests Cadence shares are priced well above what its long-term cash flow potential would justify at this moment.
Result: OVERVALUED
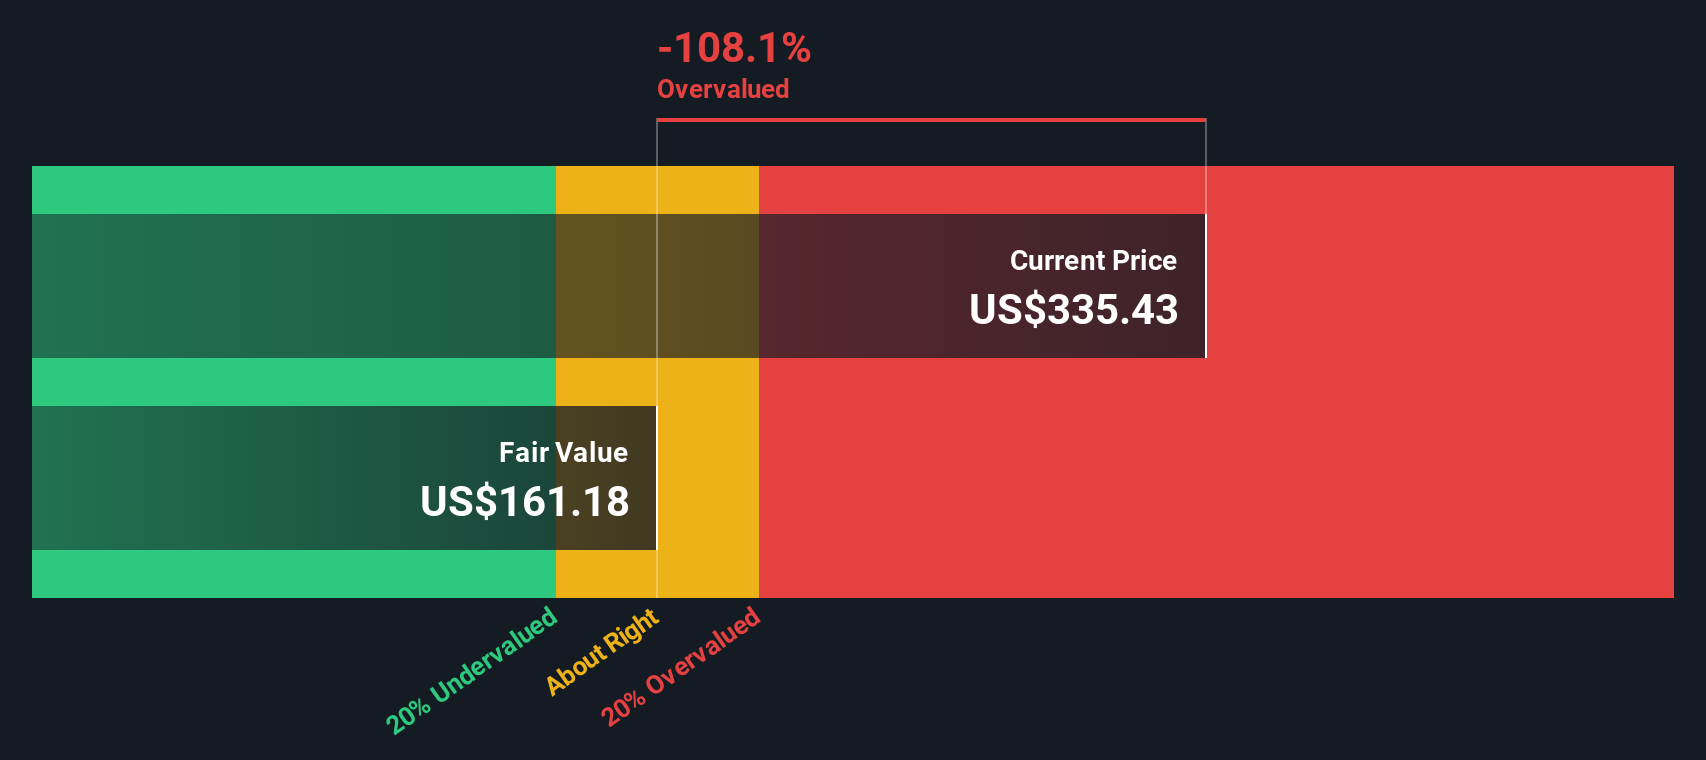
Our Discounted Cash Flow (DCF) analysis suggests Cadence Design Systems may be overvalued by 100.0%. Find undervalued stocks or create your own screener to find better value opportunities.
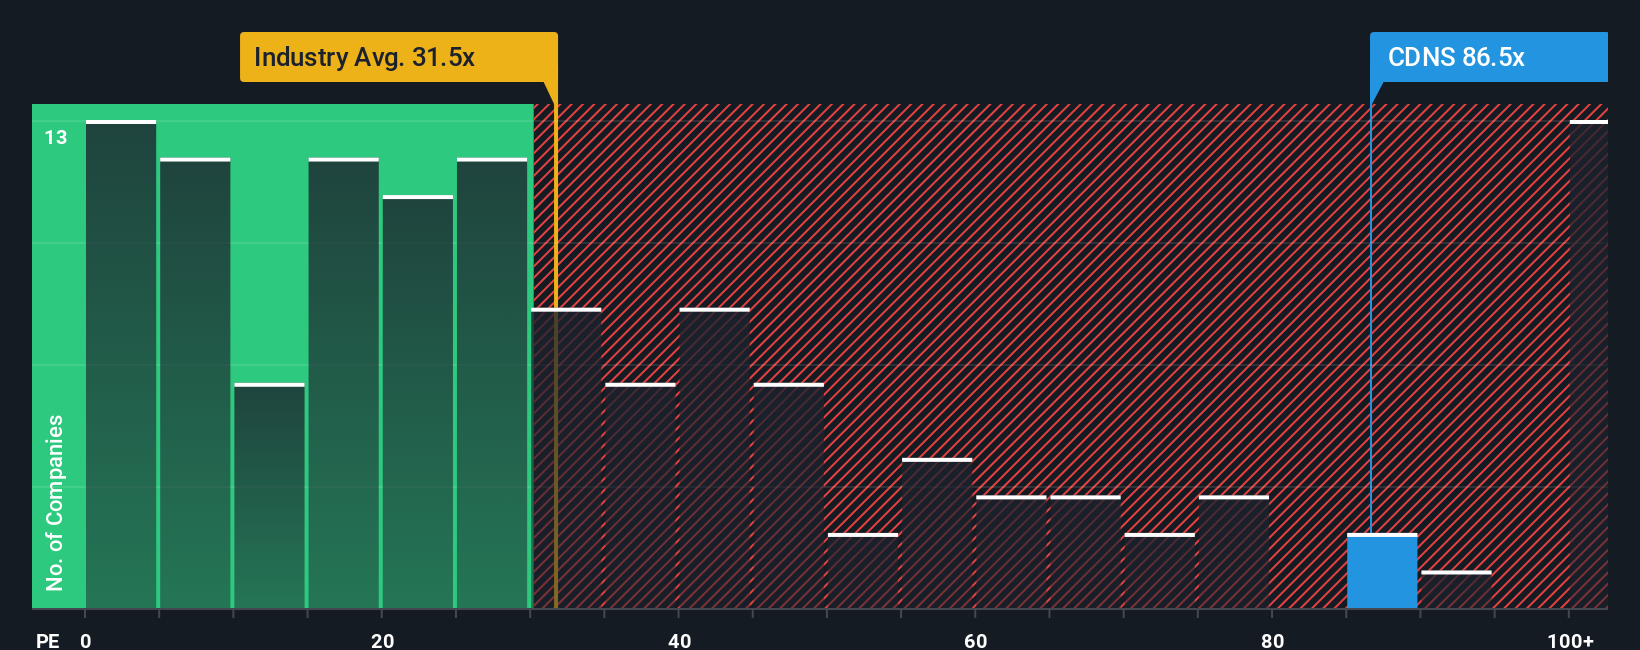
Approach 2: Cadence Design Systems Price vs Earnings
The Price-to-Earnings (PE) ratio is widely used for valuing profitable companies because it relates a company’s market value directly to its bottom-line profits. For investors, it provides a quick snapshot of how much they’re paying for each dollar of earnings, making it especially useful for mature, income-generating businesses like Cadence Design Systems.
However, a “normal” or fair PE ratio depends not just on profits, but also on growth expectations and the level of risk. High-growth, stable companies typically warrant a higher multiple than slower-growing or riskier peers, as investors are willing to pay up for future potential and predictability.
Currently, Cadence’s PE ratio stands at 90.8x, significantly higher than both the average for its software industry peers at 34.3x and the peer group average of 66.1x. While this suggests Cadence trades at a sizable premium, Simply Wall St’s proprietary “Fair Ratio,” which accounts for specific factors like Cadence’s earnings growth outlook, profit margins, size, industry context, and risk profile, pegs a fair PE for the stock at 42.3x. This approach offers a more nuanced benchmark than simple industry averages since it reflects what is reasonable for Cadence specifically, not just for software firms in general.
Comparing these numbers, Cadence’s current PE of 90.8x is more than double its Fair Ratio of 42.3x. This indicates the stock is trading at a substantial premium to its fundamentals even after accounting for its strong business qualities.
Result: OVERVALUED
PE ratios tell one story, but what if the real opportunity lies elsewhere? Discover companies where insiders are betting big on explosive growth.
Upgrade Your Decision Making: Choose your Cadence Design Systems Narrative
Earlier, we mentioned that there is an even better way to understand valuation, so let us introduce you to Narratives. A Narrative is simply your story about a company: the “why” behind your assumptions for fair value, future revenue, earnings, and profit margins. Narratives tie the company’s unique journey and business context to a financial forecast, giving you a clear and personal fair value that you can compare against the current stock price.
Available right now on Simply Wall St’s Community page, Narratives are a practical and dynamic tool used by millions of investors to clarify their thinking and inform buy or sell decisions. The strength of Narratives is that they update with every new piece of news, earnings release, or market development, so your investment perspective always stays relevant.
For example, with Cadence Design Systems, one investor might believe that ongoing AI adoption and strategic partnerships will justify a bullish fair value near $410. In contrast, a more cautious perspective, factoring in competitive and geopolitical risks, could lead to a bearish fair value closer to $200. Narratives empower you to anchor your decisions to the story you find most credible, instead of just following the crowd or a single metric.
Do you think there's more to the story for Cadence Design Systems? Create your own Narrative to let the Community know!

This article by Simply Wall St is general in nature. We provide commentary based on historical data and analyst forecasts only using an unbiased methodology and our articles are not intended to be financial advice. It does not constitute a recommendation to buy or sell any stock, and does not take account of your objectives, or your financial situation. We aim to bring you long-term focused analysis driven by fundamental data. Note that our analysis may not factor in the latest price-sensitive company announcements or qualitative material. Simply Wall St has no position in any stocks mentioned.