
Please use a PC Browser to access Register-Tadawul
Get It
Is Commercial Metals (CMC) Now At An Attractive Price After Strong Five Year Share Gains
Commercial Metals Company CMC | 76.80 | -1.11% |
A Discounted Cash Flow, or DCF, model takes the cash that a business is expected to generate in the future and discounts those amounts back to what they are worth in today's dollars. It is essentially asking what you would pay now for the stream of future cash flows.
For Commercial Metals, the model uses a 2 Stage Free Cash Flow to Equity approach based on cash flow projections. The latest twelve month free cash flow is about $271.2 million. Analyst inputs go out to 2028, where free cash flow is projected at $817.95 million, and Simply Wall St extrapolates further to 2035, with discounted values provided for each year in that path.
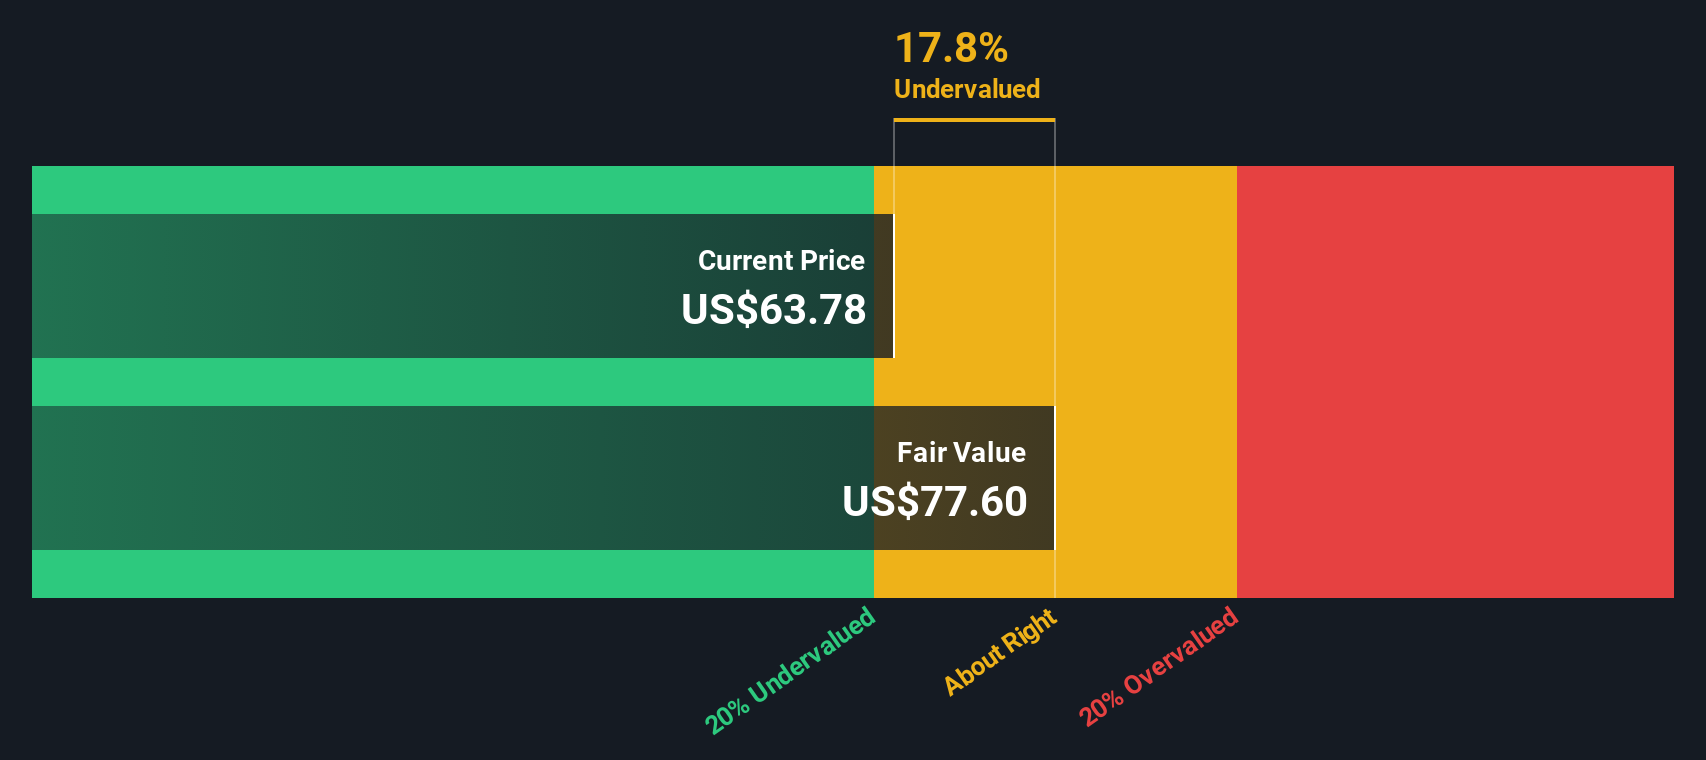
When those projected cash flows are discounted back and added up, the DCF model arrives at an estimated intrinsic value of about $118.74 per share. Compared with the recent share price of US$74.42, this implies Commercial Metals trades at roughly a 37.3% discount, which points to the stock being undervalued on this model alone.
Result: UNDERVALUED
Our Discounted Cash Flow (DCF) analysis suggests Commercial Metals is undervalued by 37.3%. Track this in your watchlist or portfolio, or discover 871 more undervalued stocks based on cash flows.
For a profitable company, the P/E ratio is a useful way to think about what you are paying for each dollar of current earnings. It gives you a quick link between the share price and the business’s ability to generate profit today.
What counts as a “normal” P/E depends a lot on how quickly earnings are expected to grow and how risky those earnings are. Higher expected growth or more stable profits can justify a higher P/E, while slower growth or higher uncertainty usually calls for a lower one.
Commercial Metals currently trades on a P/E of 18.86x. That is below the Metals and Mining industry average P/E of 27.02x and below Simply Wall St’s peer group average of 54.46x. Simply Wall St also calculates a “Fair Ratio” of 21.78x, which is the P/E it would expect for Commercial Metals after factoring in its earnings growth profile, industry, profit margins, market cap and risk characteristics.
This Fair Ratio aims to be more tailored than a simple industry or peer comparison because it adjusts for company specific traits rather than assuming all peers deserve the same multiple. With the current P/E of 18.86x below the Fair Ratio of 21.78x, the shares screen as undervalued on this approach.
Result: UNDERVALUED
P/E ratios tell one story, but what if the real opportunity lies elsewhere? Discover 1442 companies where insiders are betting big on explosive growth.
Earlier we mentioned that there is an even better way to understand valuation. On Simply Wall St you can use Narratives on the Community page to connect your view of Commercial Metals’ story with your own forecast for its future revenue, earnings and margins. You can then translate that into a Fair Value and compare it to the current price, with the Narrative updating automatically when new information such as earnings or buyback news arrives. One investor might build a Narrative that leans on the higher US$74 Fair Value estimate and focuses on completed share repurchases and revised assumptions for revenue growth, profit margins, discount rate and future P/E. Another might key off the lowest analyst price target of US$47.00 and put more weight on risks like tariffs, new rebar capacity and project delays.
Do you think there's more to the story for Commercial Metals? Head over to our Community to see what others are saying!

This article by Simply Wall St is general in nature. We provide commentary based on historical data and analyst forecasts only using an unbiased methodology and our articles are not intended to be financial advice. It does not constitute a recommendation to buy or sell any stock, and does not take account of your objectives, or your financial situation. We aim to bring you long-term focused analysis driven by fundamental data. Note that our analysis may not factor in the latest price-sensitive company announcements or qualitative material. Simply Wall St has no position in any stocks mentioned.
