
Please use a PC Browser to access Register-Tadawul
Get It
Is Gen Digital (GEN) Starting To Look Attractive After Recent Share Price Weakness
Gen Digital Inc. GEN | 22.35 | +0.04% |
A Discounted Cash Flow model estimates what a business might be worth by projecting the cash it could generate in the future, then discounting those cash flows back to today’s dollars.
For Gen Digital, the model used is a 2 Stage Free Cash Flow to Equity approach based on cash flow projections. The latest twelve month free cash flow is about $1.31b. Analysts provide free cash flow estimates out to 2028, with Simply Wall St extrapolating further to build a 10 year path. By 2035, the model uses projected free cash flow of around $1.89b, with each year’s figure discounted back to reflect the time value of money.
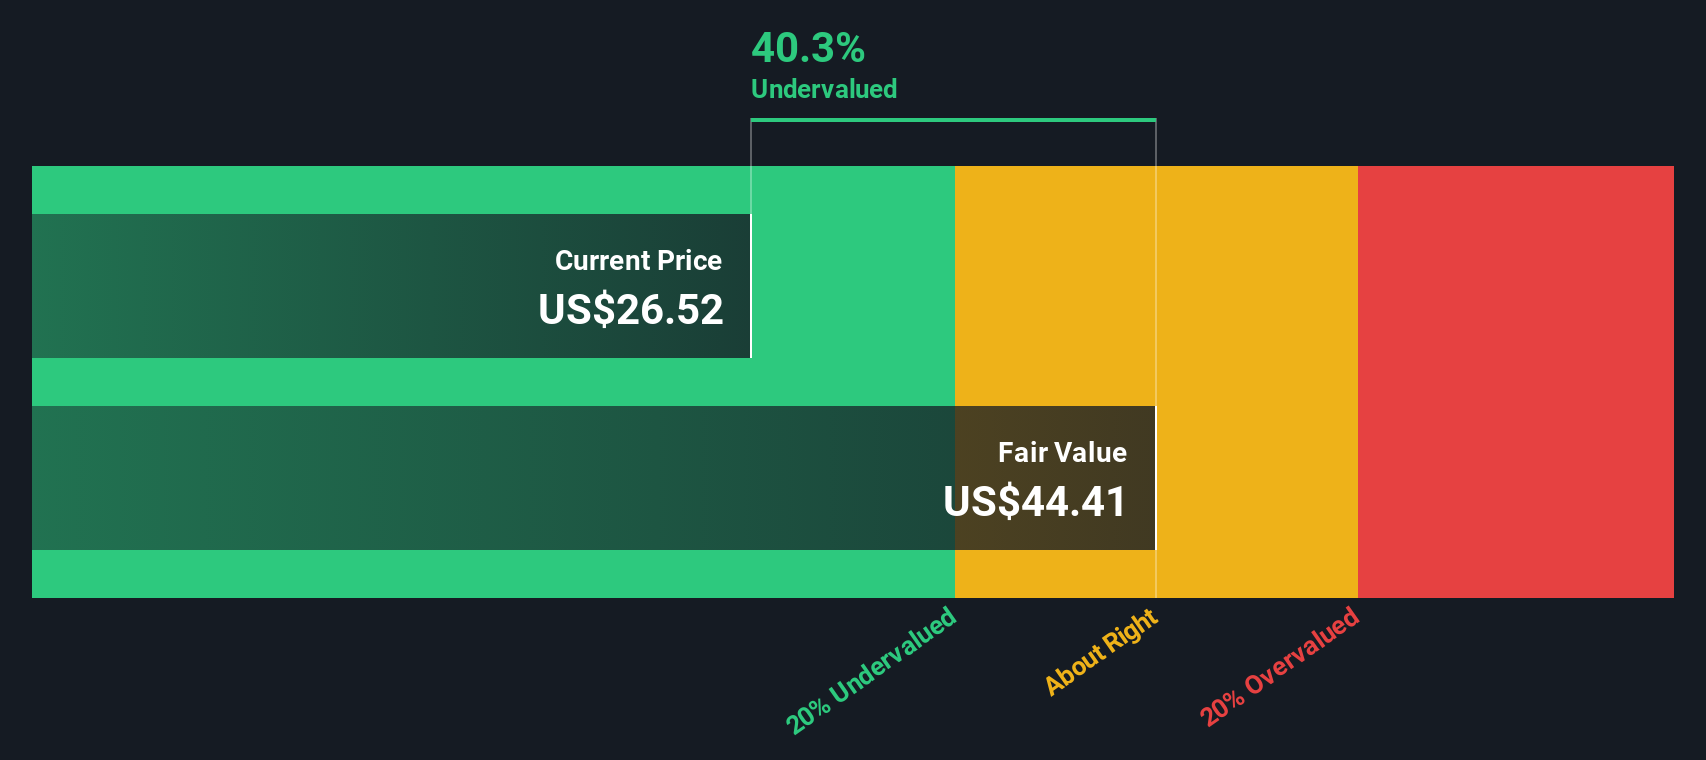
Putting all those discounted cash flows together gives an estimated intrinsic value of US$34.17 per share. Compared with the recent share price of around US$22.43, the DCF output suggests the stock is about 34.4% undervalued on this set of assumptions.
Result: UNDERVALUED
Our Discounted Cash Flow (DCF) analysis suggests Gen Digital is undervalued by 34.4%. Track this in your watchlist or portfolio, or discover 55 more high quality undervalued stocks.
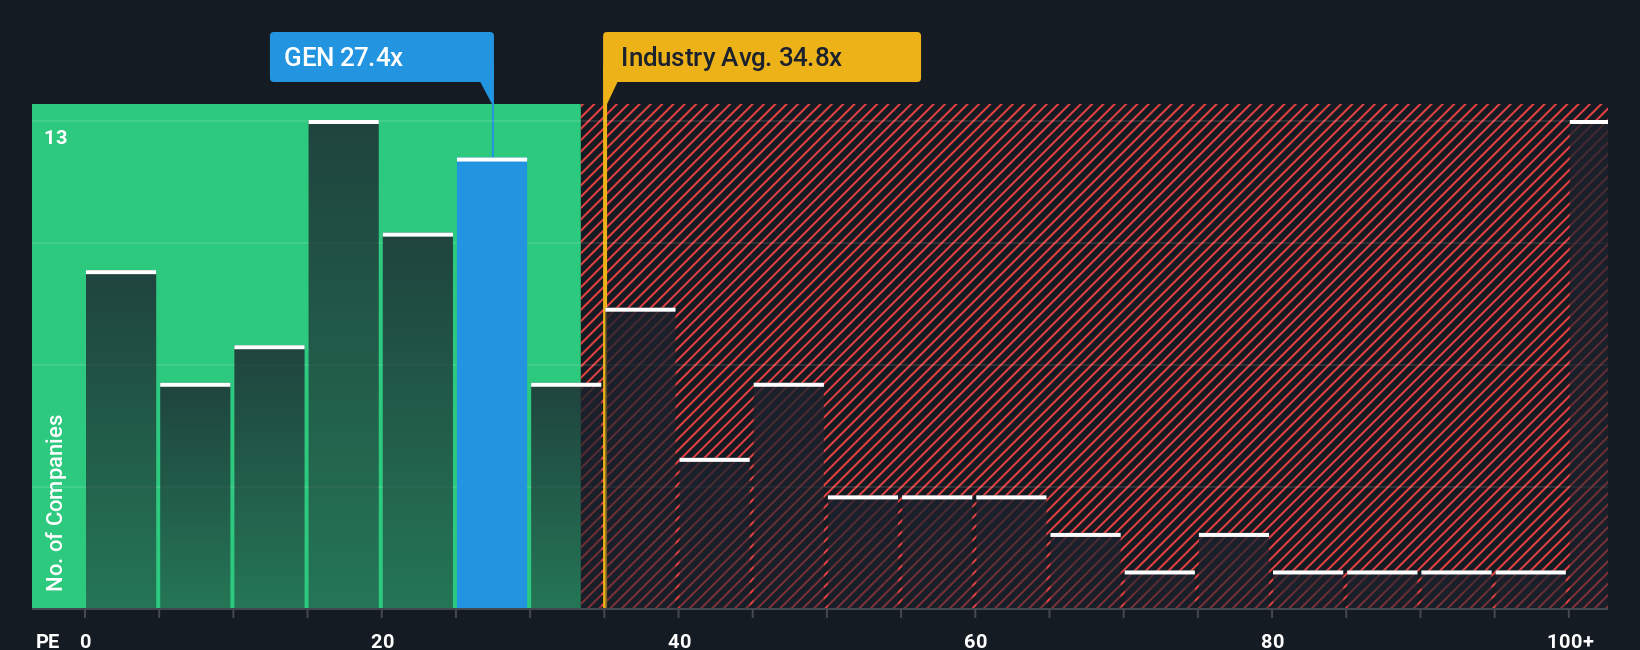
For profitable companies, the P/E ratio is a useful yardstick because it links what you pay directly to the earnings the business is already generating. It gives you a quick sense of how many dollars investors are willing to pay today for each dollar of earnings.
What counts as a “normal” P/E depends on how the market views a company’s growth potential and risk profile. Higher expected growth and lower perceived risk can justify a higher multiple, while slower growth or higher uncertainty usually go with a lower one.
Gen Digital currently trades on a P/E of 24.27x. That sits below the average for its software peers at 28.35x, and also below the broader Software industry average of about 25.66x. Simply Wall St goes a step further with its proprietary “Fair Ratio” of 28.63x for Gen Digital, which reflects factors such as earnings growth expectations, industry, profit margins, market cap and company specific risks.
Compared with simple peer or industry comparisons, the Fair Ratio is more tailored to Gen Digital’s own profile, since it adjusts for both growth and risk rather than assuming one size fits all. With the current P/E of 24.27x below the Fair Ratio of 28.63x, this approach suggests that the shares may be trading at a lower valuation on an earnings basis.
Result: POTENTIALLY UNDERVALUED
P/E ratios tell one story, but what if the real opportunity lies elsewhere? Start investing in legacies, not executives. Discover our 22 top founder-led companies.
Earlier we mentioned that there is an even better way to understand valuation, so let us introduce you to Narratives, which let you connect your view of Gen Digital’s future to concrete numbers like revenue, earnings and margins, and then to your own fair value estimate. A Narrative is simply your story about the company, written into a forecast that the Simply Wall St platform turns into cash flow, earnings and fair value outputs. Instead of only looking at a single DCF or P/E, Narratives help you compare your Fair Value with today’s price, so you can decide for yourself whether Gen Digital looks expensive or cheap at any point in time. They sit inside the Community page on Simply Wall St, used by millions of investors, and update automatically when new information such as news or earnings is added. For example, one Gen Digital Narrative might assume very cautious revenue growth and a lower fair value, while another could use stronger revenue assumptions and higher margins to support a higher fair value, and you can see both side by side.
Do you think there's more to the story for Gen Digital? Head over to our Community to see what others are saying!
This article by Simply Wall St is general in nature. We provide commentary based on historical data and analyst forecasts only using an unbiased methodology and our articles are not intended to be financial advice. It does not constitute a recommendation to buy or sell any stock, and does not take account of your objectives, or your financial situation. We aim to bring you long-term focused analysis driven by fundamental data. Note that our analysis may not factor in the latest price-sensitive company announcements or qualitative material. Simply Wall St has no position in any stocks mentioned.
