Is Globus Medical (GMED) Pricing Fair After The Recent Healthcare Sector Reassessment?
Globus Medical Inc Class A GMED | 0.00 |
- If you are looking at Globus Medical and wondering whether the current share price lines up with its underlying worth, this article is built to walk you through that question step by step.
- The stock recently closed at US$87.45, with returns of 4.9% decline over 7 days, 0.2% over 30 days, 0.2% year to date, 5.1% decline over 1 year, 12.3% over 3 years, and 34.9% over 5 years, which may shape how investors think about both its potential and its risks.
- Recent news coverage around Globus Medical has focused on how the market is reassessing medical device companies generally and how capital is being allocated across the healthcare sector. This context has fed into how investors interpret Globus Medical's share price moves and the expectations being priced in.
- Right now, Globus Medical scores 5 out of 6 on our valuation checks, giving it a value score of 5. We will walk through the methods behind that, then finish by looking at a more complete way to think about valuation that goes beyond the usual ratios.
Approach 1: Globus Medical Discounted Cash Flow (DCF) Analysis
A Discounted Cash Flow model takes estimates of the cash a company could generate in the future, then discounts those cash flows back to what they might be worth in $ today.
For Globus Medical, the model starts with last twelve months free cash flow of about $573.8 million and then uses a 2 Stage Free Cash Flow to Equity approach. Analysts provide specific forecasts up to 2027, with free cash flow for that year at $672.7 million, and Simply Wall St extrapolates beyond that. By 2035, the projection used in the model is $932.0 million, all still in $ and all discounted back to today.
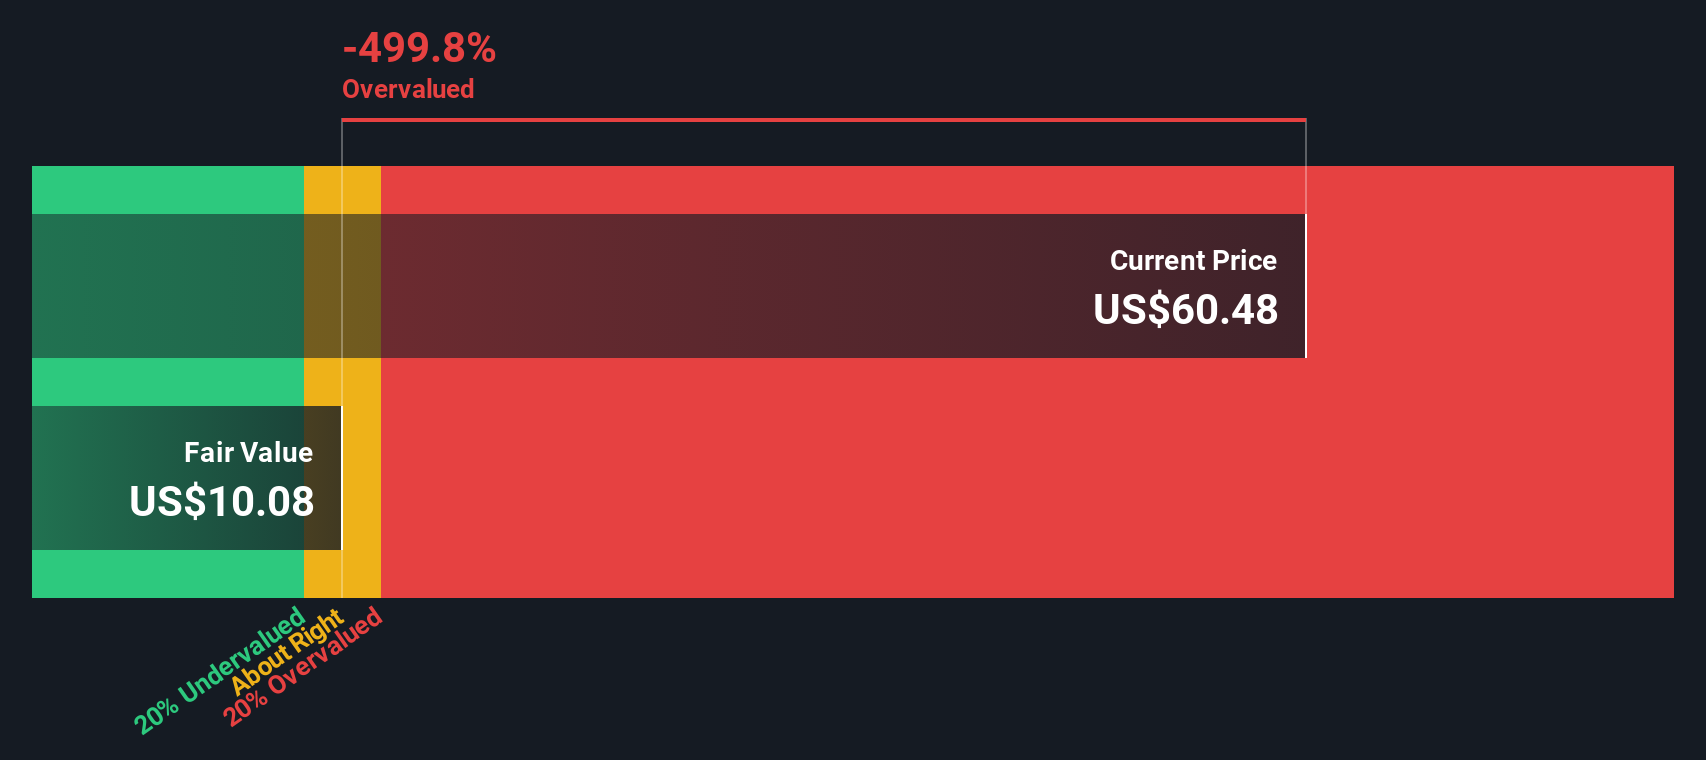
Adding these discounted cash flows together leads to an estimated intrinsic value of $115.52 per share under this DCF model. Compared with the recent share price of $87.45, the model output suggests the stock is 24.3% undervalued on these cash flow assumptions.
Result: UNDERVALUED
Our Discounted Cash Flow (DCF) analysis suggests Globus Medical is undervalued by 24.3%. Track this in your watchlist or portfolio, or discover 867 more undervalued stocks based on cash flows.
Approach 2: Globus Medical Price vs Earnings
For a profitable company like Globus Medical, the P/E ratio is a useful way to think about what you are paying for each dollar of earnings. It gives a quick sense of how the market is weighing the company’s prospects and risks against its current profits.
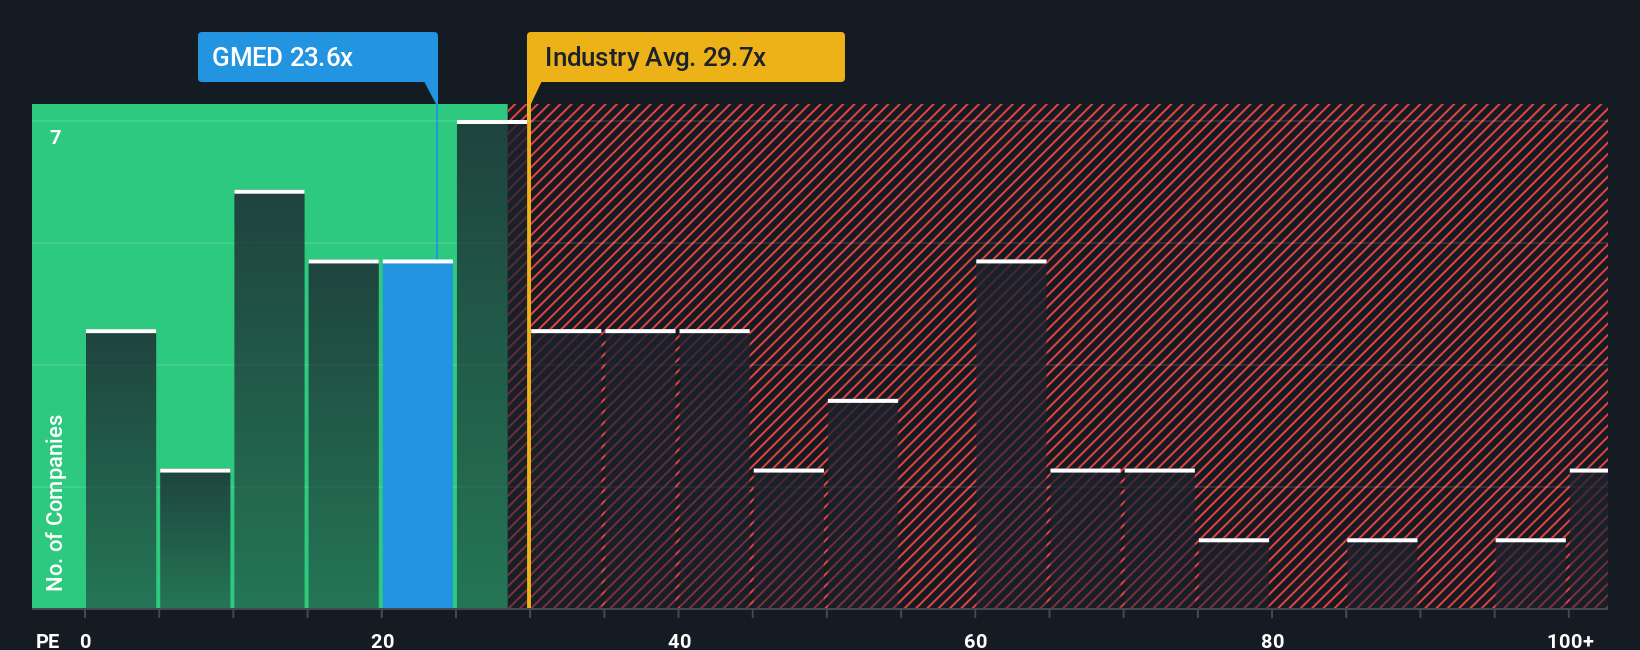
In general, higher growth expectations or lower perceived risk can justify a higher P/E, while slower growth or higher risk usually line up with a lower multiple. Globus Medical currently trades on a P/E of 27.62x. That sits below the Medical Equipment industry average of 30.64x and below the peer group average of 52.16x. This suggests the stock is priced more conservatively than many of its listed peers.
Simply Wall St also calculates a proprietary “Fair Ratio” for Globus Medical of 24.06x. This is designed to be a more tailored benchmark than a simple industry or peer comparison, because it factors in metrics such as earnings growth, profit margins, risk profile, industry and market cap. Against this Fair Ratio, the current P/E of 27.62x is higher. This points to the shares trading at a premium on this metric.
Result: OVERVALUED
P/E ratios tell one story, but what if the real opportunity lies elsewhere? Discover 1422 companies where insiders are betting big on explosive growth.
Upgrade Your Decision Making: Choose your Globus Medical Narrative
Earlier we mentioned that there is an even better way to understand valuation, so let us introduce you to Narratives, which are simply your story about a company linked directly to your own numbers for fair value, future revenue, earnings and margins.
A Narrative connects three things: what you think is happening at Globus Medical, how that story flows into a financial forecast, and the fair value that drops out of those assumptions.
On Simply Wall St, Narratives sit in the Community page and are designed to be quick to set up, easy to adjust and available to millions of investors who want their view of Globus Medical to be more than just a P/E multiple.
Once you have a Narrative, you can compare your fair value to today’s share price and use that gap to help you decide whether Globus Medical looks attractive, fairly priced or expensive on your assumptions.
Narratives also update when fresh information such as earnings releases or news is added, so your view of fair value can evolve as the facts change rather than staying frozen at one point in time.
For example, one Globus Medical Narrative on the Community page might point to a fair value well below US$87.45, while another points to a value well above that, reflecting different expectations for future margins and growth.
Do you think there's more to the story for Globus Medical? Head over to our Community to see what others are saying!

This article by Simply Wall St is general in nature. We provide commentary based on historical data and analyst forecasts only using an unbiased methodology and our articles are not intended to be financial advice. It does not constitute a recommendation to buy or sell any stock, and does not take account of your objectives, or your financial situation. We aim to bring you long-term focused analysis driven by fundamental data. Note that our analysis may not factor in the latest price-sensitive company announcements or qualitative material. Simply Wall St has no position in any stocks mentioned.