Is Globus Medical (GMED) Pricing Reflect Its DCF Upside And Mixed P/E Signals?
Globus Medical Inc Class A GMED | 89.82 | +1.38% |
- If you are wondering whether Globus Medical is fairly priced right now or if the market is missing something, you are not alone.
- The share price recently closed at US$92.52, with returns of a 1% decline over 7 days, 4.6% over 30 days, 6.0% year to date, a 0.3% decline over 1 year, 22.0% over 3 years and 50.0% over 5 years. This may hint at changing views on its growth potential and risk.
- Recent company updates and sector headlines around spine and orthopedics businesses have kept Globus Medical on investors' radars, as they reassess how the business is positioned in its market. This backdrop helps frame whether recent price moves line up with the underlying value of the company.
- Globus Medical currently scores 3 out of 6 on our valuation checks. Next, we will compare different valuation approaches before finishing with a way to look beyond the numbers for a fuller view of value.
Approach 1: Globus Medical Discounted Cash Flow (DCF) Analysis
A Discounted Cash Flow, or DCF, model estimates what a company might be worth today by projecting its future cash flows and then discounting those back to a present value.
For Globus Medical, the model uses a 2 Stage Free Cash Flow to Equity approach, starting from last twelve months free cash flow of about $573.8 million. Analysts provide free cash flow estimates out to 2027, and Simply Wall St then extrapolates those projections further. By 2035, the model is using an implied free cash flow of about $930.2 million, with each year in between discounted back to today.
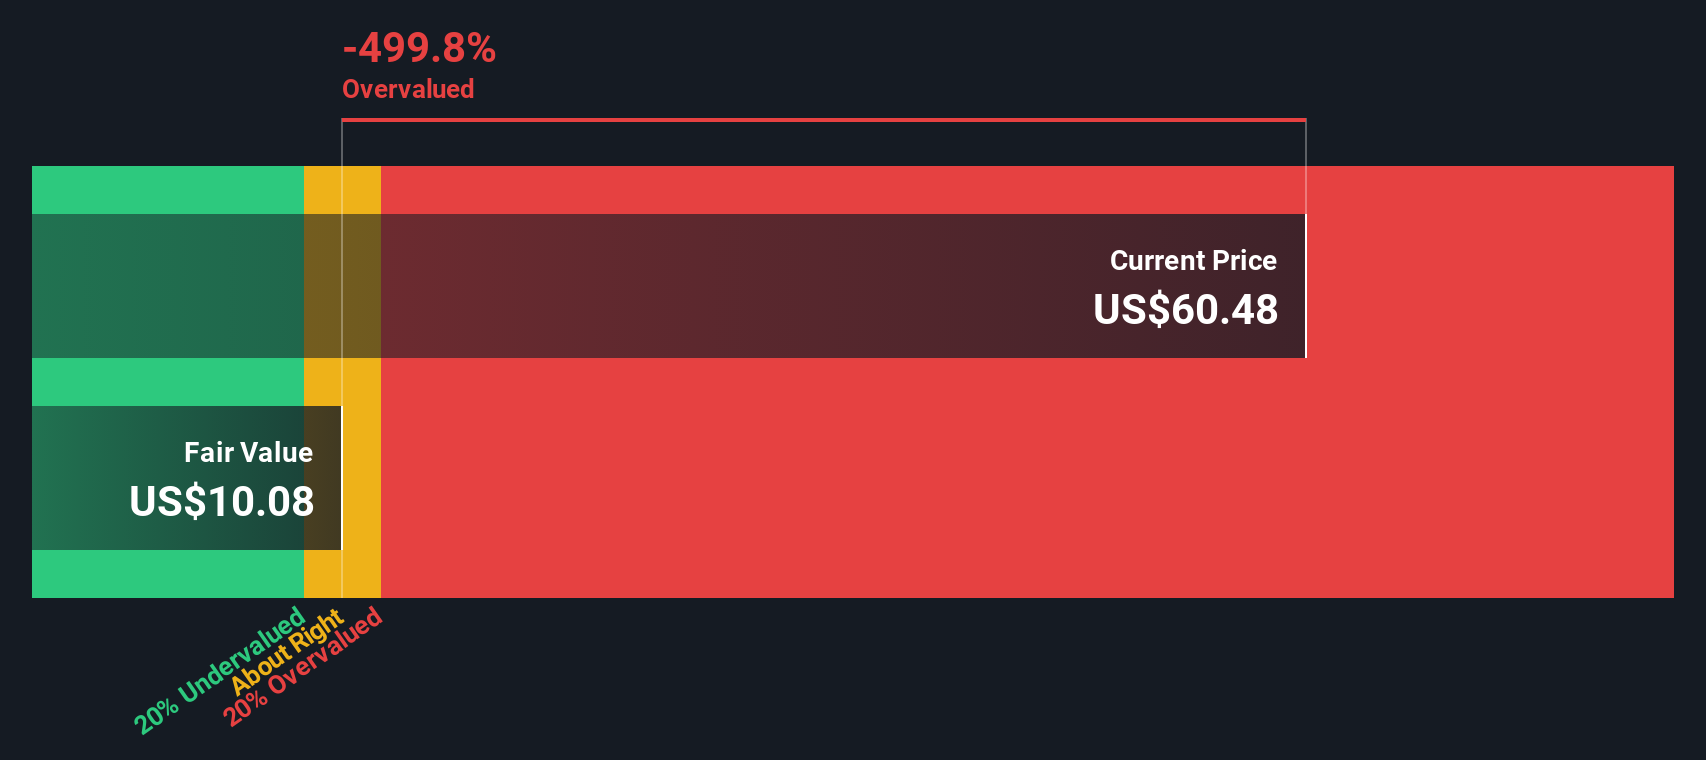
On this basis, the DCF model arrives at an estimated intrinsic value of about $114.59 per share. Compared with the recent share price of US$92.52, this suggests the stock is 19.3% undervalued according to these cash flow assumptions.
Result: UNDERVALUED
Our Discounted Cash Flow (DCF) analysis suggests Globus Medical is undervalued by 19.3%. Track this in your watchlist or portfolio, or discover 862 more undervalued stocks based on cash flows.
Approach 2: Globus Medical Price vs Earnings
For profitable companies, the P/E ratio is a useful way to relate what you pay for each share to the earnings that business is currently generating. It gives you a quick sense of how many dollars investors are willing to pay today for one dollar of earnings.
What counts as a “normal” P/E depends on how the market views a company’s growth prospects and risk. Higher expected growth and perceived resilience often justify a higher multiple, while more uncertainty or lower growth usually comes with a lower one.
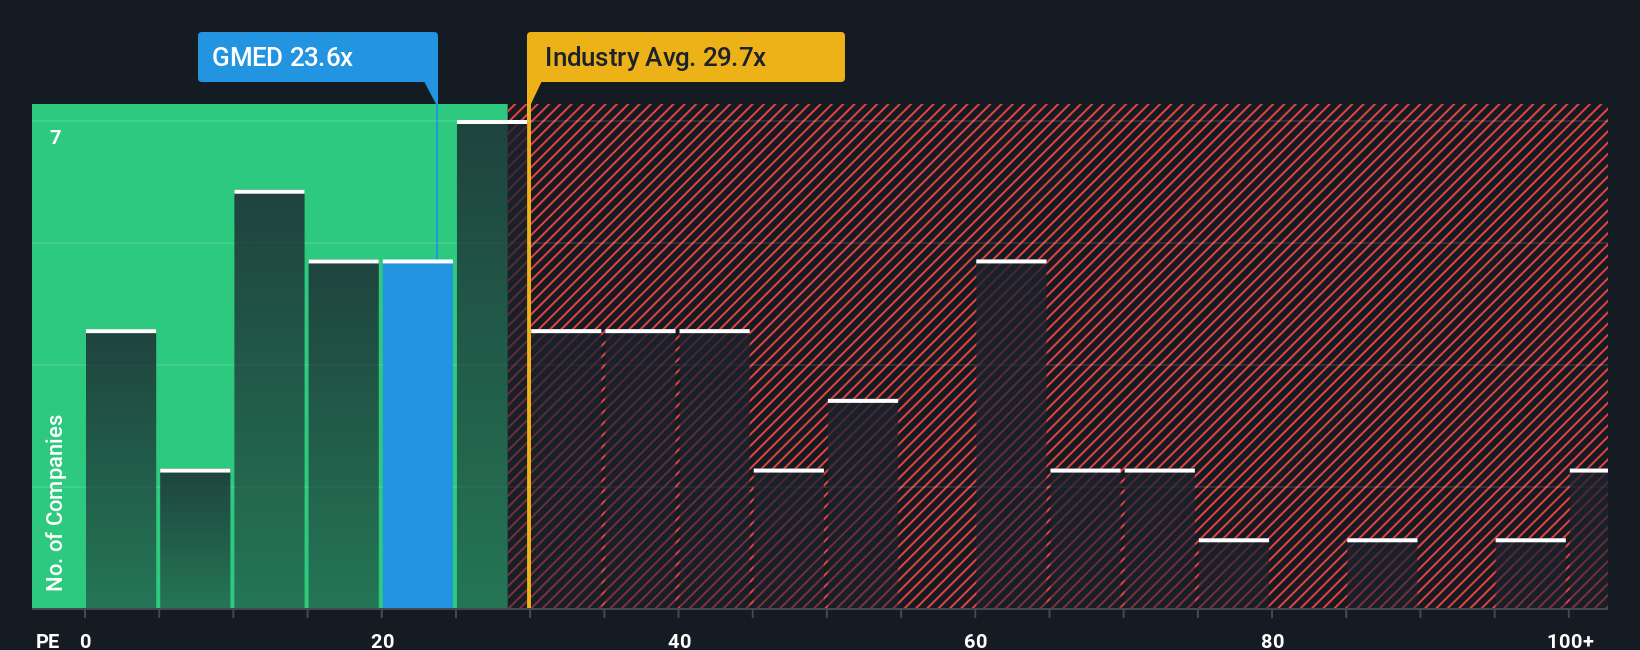
Globus Medical currently trades at a P/E of 29.22x. That sits below the Medical Equipment industry average of 31.99x and well below the peer group average of 53.56x. Simply Wall St’s Fair Ratio for Globus Medical is 22.15x, which is the P/E level its model suggests given factors such as earnings growth, industry, profit margins, market cap and specific risks.
This Fair Ratio is more tailored than a simple comparison with peers or the industry because it attempts to align the multiple with the company’s own profile rather than broad group averages. Compared with this Fair Ratio, Globus Medical’s current 29.22x P/E appears higher than what the model suggests.
Result: OVERVALUED
P/E ratios tell one story, but what if the real opportunity lies elsewhere? Discover 1421 companies where insiders are betting big on explosive growth.
Upgrade Your Decision Making: Choose your Globus Medical Narrative
Earlier we mentioned that there is an even better way to understand valuation, so let us introduce you to Narratives, which put a clear story behind the numbers you are using for fair value, revenue, earnings and margins.
A Narrative is your view of what Globus Medical is doing, where it might head, and how that could translate into future financials that then flow into a fair value estimate.
On Simply Wall St, within the Community page used by millions of investors, Narratives are an easy tool that link the company’s story to a forecast and then to a fair value you can compare with today’s share price. This can help you decide whether you want to treat Globus Medical as a possible buy, hold or sell.
Narratives on the platform update automatically when new information such as earnings releases or major news is added, so your fair value view can stay aligned with the latest data.
For example, one Globus Medical Narrative might assume a relatively high fair value based on stronger long term revenue growth and margins. Another might sit at the lower end because it assumes more modest growth and profitability, and both can be compared side by side with the current price.
Do you think there's more to the story for Globus Medical? Head over to our Community to see what others are saying!

This article by Simply Wall St is general in nature. We provide commentary based on historical data and analyst forecasts only using an unbiased methodology and our articles are not intended to be financial advice. It does not constitute a recommendation to buy or sell any stock, and does not take account of your objectives, or your financial situation. We aim to bring you long-term focused analysis driven by fundamental data. Note that our analysis may not factor in the latest price-sensitive company announcements or qualitative material. Simply Wall St has no position in any stocks mentioned.