
Please use a PC Browser to access Register-Tadawul
Get It
Is Group 1 Automotive (GPI) Pricing Look Attractive After Recent Share Price Weakness
Group 1 Automotive, Inc. GPI | 342.30 | +3.11% |
A Discounted Cash Flow model takes projected future cash flows and discounts them back to what they might be worth today, so you can compare that value with the current share price.
For Group 1 Automotive, the model uses last twelve months Free Cash Flow of about US$573.1 million as a starting point, then builds out a two stage Free Cash Flow to Equity profile. Analysts provide near term estimates, including projected Free Cash Flow of US$519.0 million in 2027. Simply Wall St then extrapolates further out to 2035 with annual projections in the US$460.0 million to US$558.7 million range, all in US$.
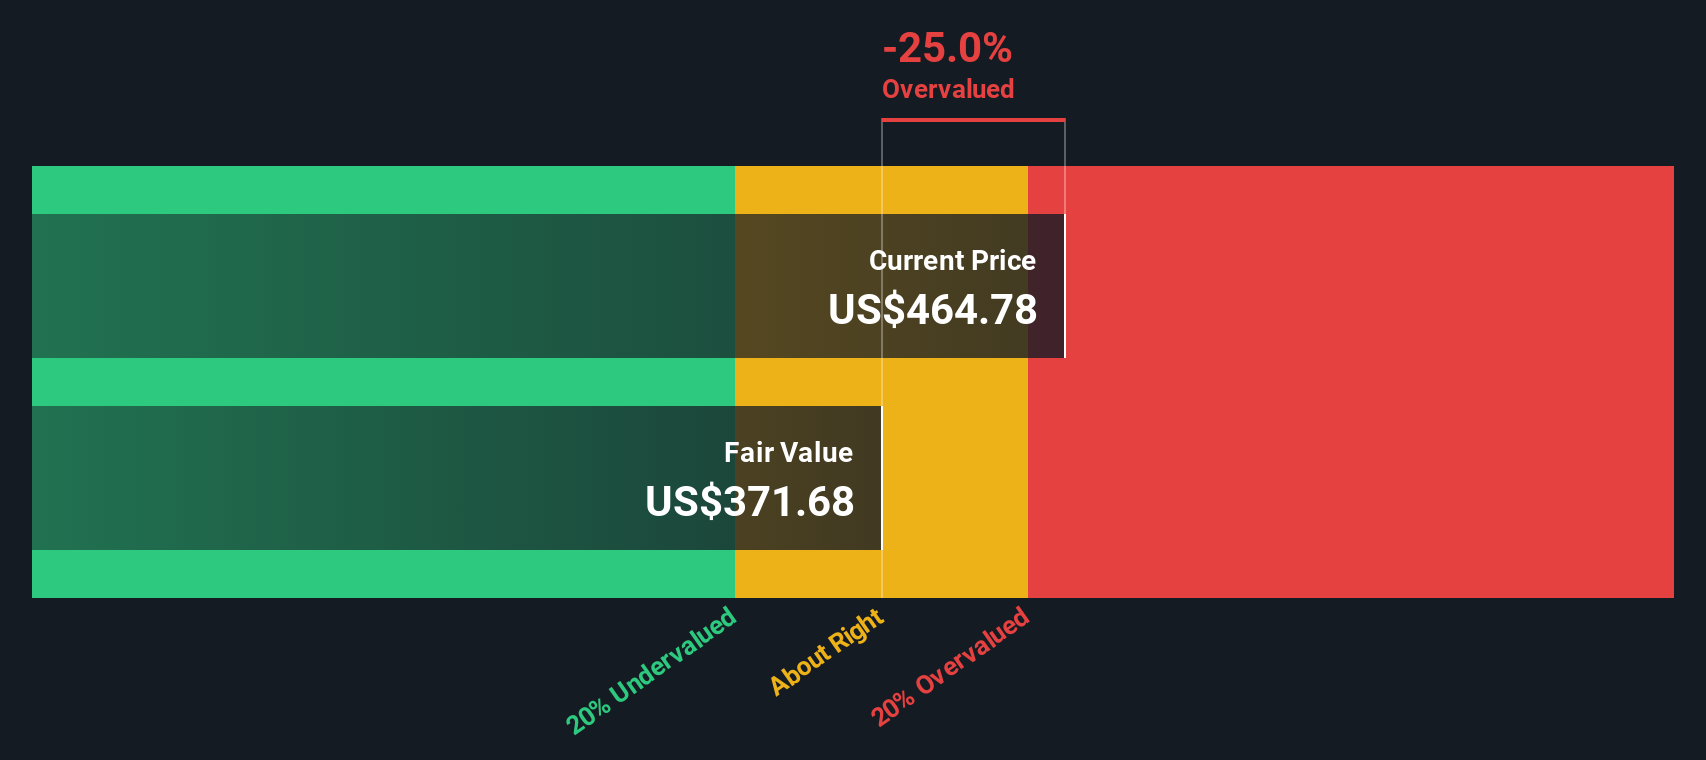
Discounting those projected cash flows back to today gives an estimated intrinsic value of about US$417.94 per share. Compared with the recent share price of US$395.06, the model implies the stock is around 5.5% undervalued, which sits within a range many investors might view as broadly in line with fair value.
Result: ABOUT RIGHT
Group 1 Automotive is fairly valued according to our Discounted Cash Flow (DCF), but this can change at a moment's notice. Track the value in your watchlist or portfolio and be alerted on when to act.
For profitable companies, the P/E ratio is a useful way to relate what you pay for each share to the earnings that business is currently generating. It helps you see how much the market is willing to pay for every dollar of earnings.
What counts as a "normal" P/E often reflects how quickly earnings are expected to grow and how risky those earnings might be. Higher expected growth or lower perceived risk can support a higher multiple, while slower growth or higher risk tends to point to a lower one.
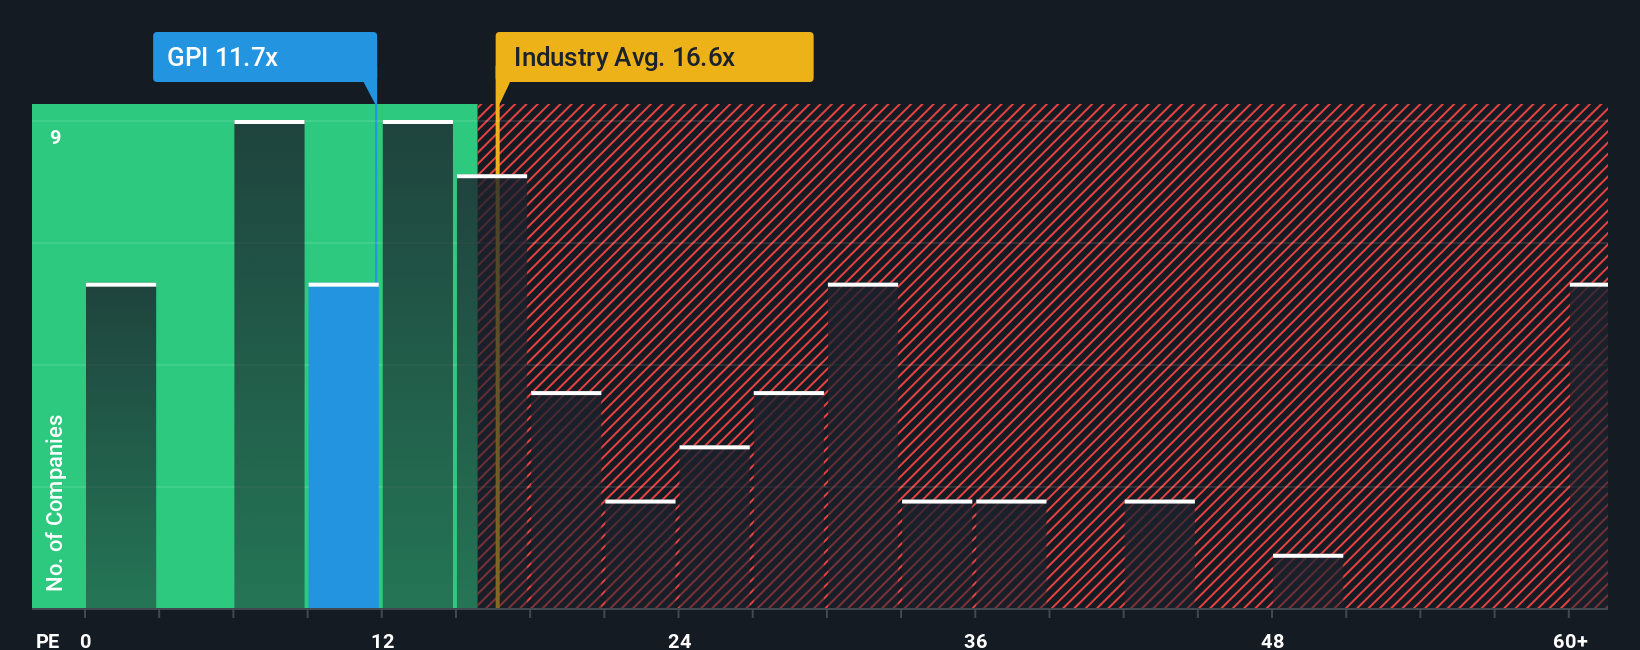
Group 1 Automotive is trading on a P/E of 13.20x. That sits below the Specialty Retail industry average P/E of 20.69x and is close to the peer average of 12.83x. Simply Wall St also calculates a proprietary Fair Ratio of 17.58x for Group 1 Automotive, which is the P/E level suggested by factors such as its earnings growth profile, industry, profit margins, market cap and company specific risks.
This Fair Ratio aims to be more tailored than a simple comparison with peers or the industry, because it folds those fundamentals into a single yardstick. With the current 13.20x P/E sitting below the 17.58x Fair Ratio, this framework points to the shares screening as undervalued on earnings.
Result: UNDERVALUED
P/E ratios tell one story, but what if the real opportunity lies elsewhere? Discover 1445 companies where insiders are betting big on explosive growth.
Earlier we mentioned that there is an even better way to understand valuation, so let us introduce you to Narratives. These let you turn your view of Group 1 Automotive into a simple story that connects what you think about its future revenue, earnings and margins to a financial forecast, a fair value, and then a clear comparison with today’s share price. All of this is available within an easy tool on Simply Wall St’s Community page that millions of investors already use. Those Narratives automatically refresh when new information such as news or earnings arrives. One investor might build a more optimistic story around a US$560.0 fair value, while another might anchor on a more cautious US$401.0 view, and each can quickly see whether they believe the current price gives them enough upside or not.
Do you think there's more to the story for Group 1 Automotive? Head over to our Community to see what others are saying!
This article by Simply Wall St is general in nature. We provide commentary based on historical data and analyst forecasts only using an unbiased methodology and our articles are not intended to be financial advice. It does not constitute a recommendation to buy or sell any stock, and does not take account of your objectives, or your financial situation. We aim to bring you long-term focused analysis driven by fundamental data. Note that our analysis may not factor in the latest price-sensitive company announcements or qualitative material. Simply Wall St has no position in any stocks mentioned.
