Is Hanover Insurance Group’s Rally Justified After Outpacing Peers in 2025?
Hanover Insurance Group, Inc. THG | 0.00 |
If you’re holding Hanover Insurance Group stock, or thinking about buying in, you’re probably weighing the same question as everyone else: is it still a smart value, or has the recent rally stretched things too far? The company’s share price has notched an impressive 18.3% gain year-to-date, building on returns of over 24% for the past year and a remarkable 118.3% climb across five years. Over just the past month, shares have jumped 6.4%, which may indicate that investors are taking a fresh look, perhaps due to shifting sentiment in the insurance sector as interest rates and economic optimism remain in the headlines.
Despite the steady climb, Hanover Insurance Group still boasts a value score of 5 out of 6 across major undervaluation checks. That means by nearly every traditional yardstick, there is evidence the stock remains priced below its true worth. For anyone who has watched from the sidelines, these numbers suggest the party isn’t necessarily over, and for long-term holders, it could hint at further upside.
Before rushing to any conclusions, though, it pays to dig into how analysts come up with those value scores. In the next section, we’ll break down the different approaches to stock valuation and how Hanover fits into each. If you’re looking for an even clearer answer, stay tuned for a perspective at the end of the article that often gets overlooked in the usual discussions.
Hanover Insurance Group delivered 24.1% returns over the last year. See how this stacks up to the rest of the Insurance industry.Approach 1: Hanover Insurance Group Excess Returns Analysis
The Excess Returns model evaluates how much value a company creates over and above the cost of equity for its shareholders. Simply put, it looks at whether Hanover Insurance Group is generating higher returns on its investments than what it costs to fund those investments, resulting in what are called "excess returns."
For Hanover Insurance Group, the numbers are impressive. The company currently has a book value of $89.59 per share, while its stabilized earnings per share (EPS) are $18.29. This figure is built from weighted future return on equity estimates from six analysts. The cost of equity comes in at $7.09 per share, leaving an excess return of $11.20 per share. This means that, on average, Hanover generates a 17.49% return on equity, supporting a projected stable book value of $104.56 per share, as estimated by five analysts.
According to the Excess Returns valuation, Hanover Insurance Group's intrinsic value is significantly higher than its current share price. The analysis implies the stock is currently about 55.8% undervalued, which is a strong margin that tilts the balance in favor of buyers willing to bet on continued performance and efficiency.
Result: UNDERVALUED
Head to the Valuation section of our Company Report for more details on how we arrive at this Fair Value for Hanover Insurance Group.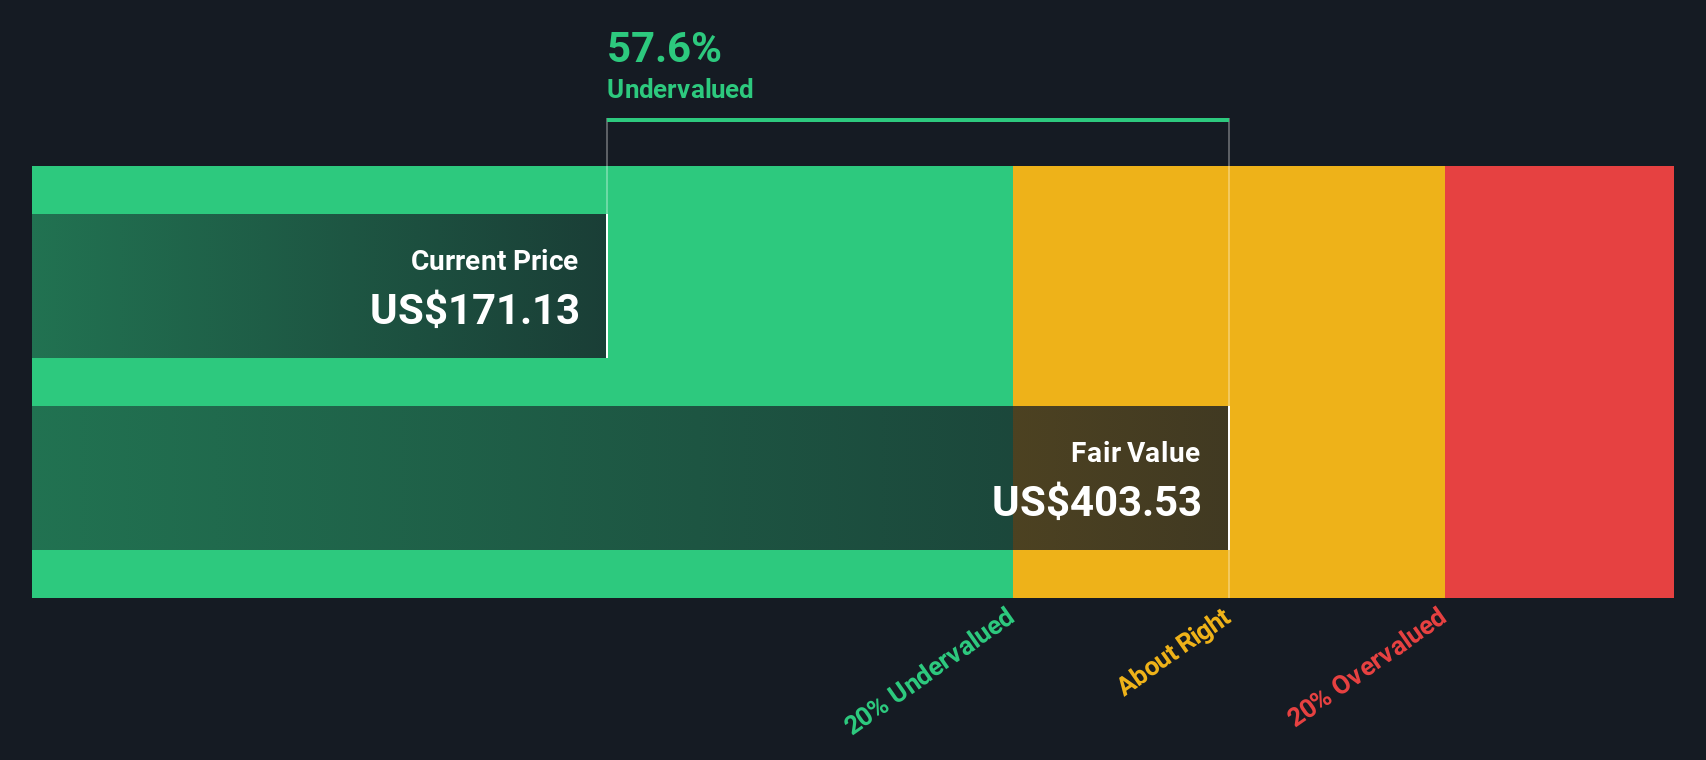
Approach 2: Hanover Insurance Group Price vs Earnings
The Price-to-Earnings (PE) ratio is a classic measure for valuing established, profitable companies like Hanover Insurance Group because it relates a company's share price to its earnings, offering investors a quick gauge of value relative to profitability. For companies generating steady profits, the PE ratio helps investors weigh whether a stock is relatively cheap or expensive in relation to its peers and the market as a whole.
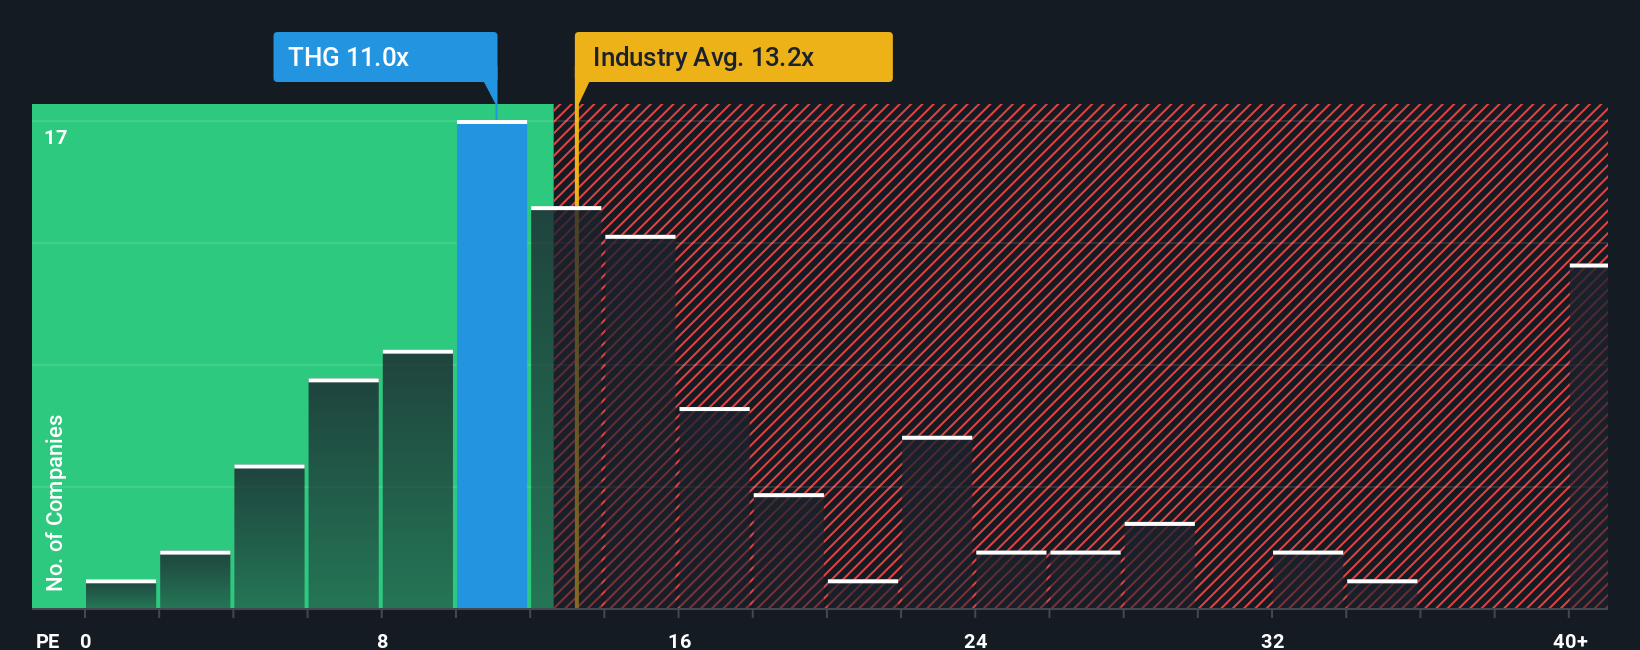
Growth expectations and risk are two big factors that shape what counts as a “normal” or “fair” PE ratio. Fast-growing or lower-risk businesses are often given higher PE ratios, while slower-growing or higher-risk businesses tend to trade at a discount. Comparing Hanover’s current PE of 11.64x to the insurance industry average of 14.43x and a peer average of 19.31x, the company initially looks attractively valued. However, these simple averages do not always tell the full story.
That is where Simply Wall St's proprietary "Fair Ratio" comes in. Unlike straightforward peer or industry comparisons, the Fair Ratio, estimated here at 12.35x, takes into account Hanover's own earnings growth, profitability, market size, risks, and its industry fundamentals. This makes it a more tailored and accurate benchmark for determining if the current PE ratio matches the company's story.
With Hanover’s PE at 11.64x and its Fair Ratio at 12.35x, the stock is trading slightly below this evidence-based benchmark. This suggests shares are currently undervalued on a relative basis using the PE approach.
Result: UNDERVALUED
Upgrade Your Decision Making: Choose your Hanover Insurance Group Narrative
Earlier we mentioned that there is an even better way to understand valuation, so let's introduce you to Narratives. A Narrative is simply your own investing story for Hanover Insurance Group, connecting what you believe about the company’s future to real financial forecasts and a fair value based on your assumptions.
Instead of relying only on historic numbers and averages, Narratives let you spell out what you expect for future revenue growth, profit margins, and fair value. You can then see how your view stacks up against live market prices. It's like putting your logic and perspective front and center, not just following analyst estimates or consensus.
On Simply Wall St’s Community page, you can easily explore and create Narratives, compare yours with others, and even see how your fair value estimate changes as new news or earnings come in. Millions of investors use this feature to decide if a stock like Hanover Insurance Group is a bargain or overvalued. For example, when the current share price is below your fair value, it might be a buy, and if it's above, a sell.
Some investors expect rapid digital adoption and stronger margins, setting a fair value above $197 per share. Others see more risks and competition, putting their fair value lower. Either way, your Narrative helps you invest confidently based on your own view.
Do you think there's more to the story for Hanover Insurance Group? Create your own Narrative to let the Community know!
This article by Simply Wall St is general in nature. We provide commentary based on historical data and analyst forecasts only using an unbiased methodology and our articles are not intended to be financial advice. It does not constitute a recommendation to buy or sell any stock, and does not take account of your objectives, or your financial situation. We aim to bring you long-term focused analysis driven by fundamental data. Note that our analysis may not factor in the latest price-sensitive company announcements or qualitative material. Simply Wall St has no position in any stocks mentioned.