
Please use a PC Browser to access Register-Tadawul
Get It
Is Hewlett Packard Enterprise (HPE) A Potential Opportunity After Recent Share Price Weakness?
Hewlett Packard Enterprise Co. HPE | 21.55 21.55 | -0.42% 0.00% Pre |
A Discounted Cash Flow, or DCF, model takes estimates of a company’s future cash flows and discounts them back to today using a required rate of return, to arrive at an estimate of what the whole business may be worth right now.
For Hewlett Packard Enterprise, the model used is a 2 Stage Free Cash Flow to Equity approach, based on cash flow projections in $. The latest twelve month free cash flow is about $174.5m. Analyst estimates and subsequent extrapolations by Simply Wall St point to free cash flow of $3.9b in 2030, with a path of projected figures between 2026 and 2035 that gradually build toward that level.
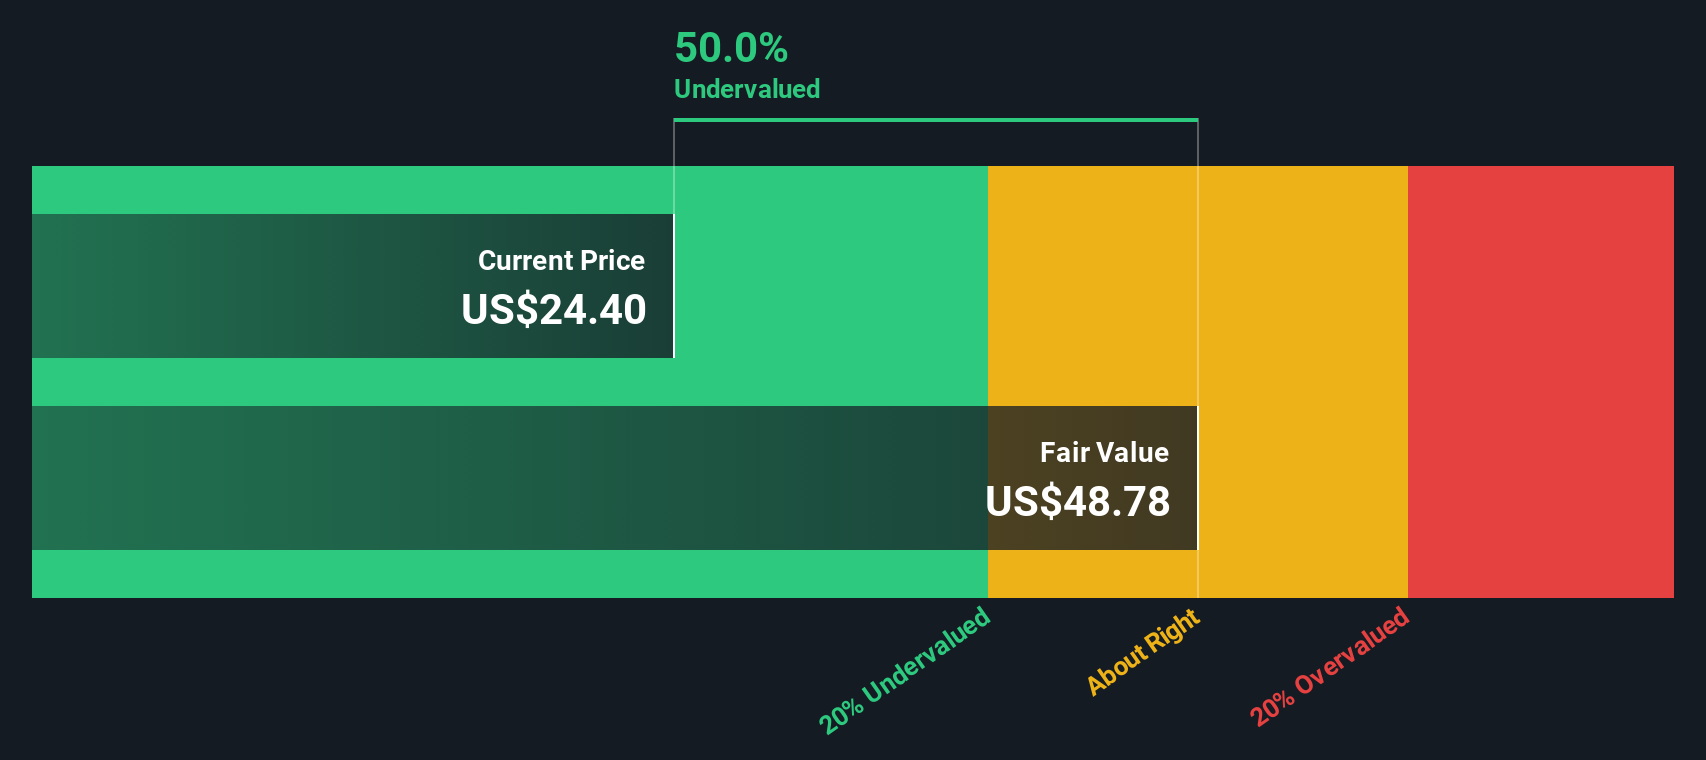
When all these projected cash flows are discounted back, the model suggests an intrinsic value of about $33.79 per share. Compared with a current share price of around $21.78, the DCF output indicates that the stock is trading at roughly a 35.5% discount on this measure.
Result: UNDERVALUED
Our Discounted Cash Flow (DCF) analysis suggests Hewlett Packard Enterprise is undervalued by 35.5%. Track this in your watchlist or portfolio, or discover 873 more undervalued stocks based on cash flows.
For many profitable companies that are actively selling products and services, the P/S ratio is a straightforward way to see what investors are paying for each dollar of revenue. It is especially useful when earnings are distorted, because it focuses on the top line rather than short term profit swings.
In practice, investors usually expect higher P/S ratios when growth expectations are strong and business risk is lower, and lower P/S ratios when growth is more modest or risks are higher. Those expectations help shape what looks like a normal or fair range for the multiple.
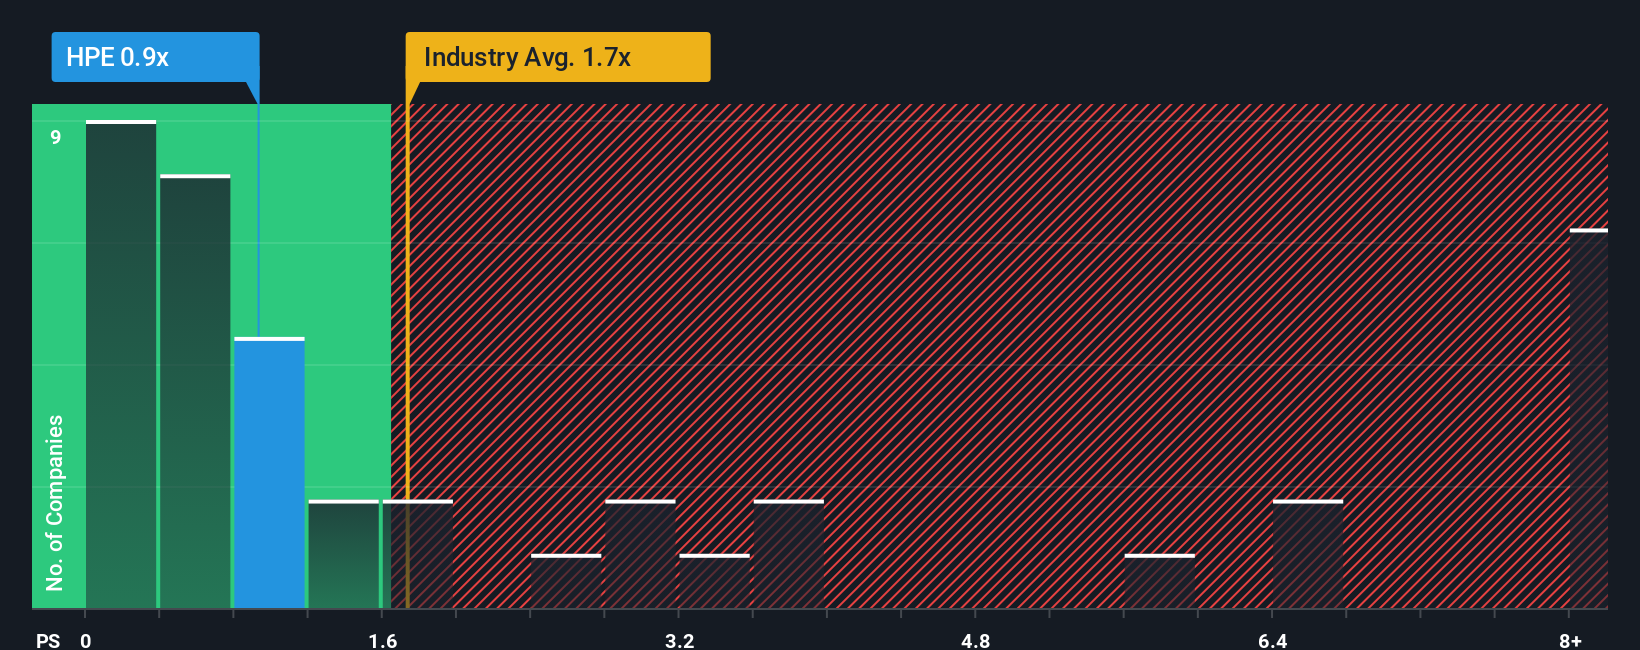
Hewlett Packard Enterprise currently trades at a P/S of 0.85x. That sits below the Tech industry average P/S of 2.11x and also below the peer group average of 5.28x. Simply Wall St’s Fair Ratio for HPE is 2.51x, which reflects what the P/S might be given factors such as its earnings profile, industry, profit margins, market cap and risk characteristics.
The Fair Ratio can be more useful than simple peer or industry comparisons because it adjusts for company specific drivers rather than assuming all tech stocks deserve the same multiple. With the current 0.85x P/S sitting well under the 2.51x Fair Ratio, this approach indicates that Hewlett Packard Enterprise screens as undervalued on a sales basis.
Result: UNDERVALUED
P/S ratios tell one story, but what if the real opportunity lies elsewhere? Discover 1426 companies where insiders are betting big on explosive growth.
Earlier we mentioned that there is an even better way to understand valuation, so let us introduce you to Narratives, which let you attach a clear story about Hewlett Packard Enterprise’s business to your own numbers for fair value, future revenue, earnings and margins, then link that story to a forecast and finally to a fair value you can compare with today’s share price.
On Simply Wall St’s Community page, millions of investors use Narratives as a simple tool. You can set your assumptions, see the resulting fair value next to the current price and quickly judge whether Hewlett Packard Enterprise looks expensive or cheap on your terms, not someone else’s model.
As new information such as earnings or news is released, these Narratives refresh. This means your Hewlett Packard Enterprise view stays aligned with the latest data rather than a static snapshot.
For example, one Hewlett Packard Enterprise Narrative might assume a relatively high fair value based on stronger long term revenue and margin expectations. Another might assume a lower fair value based on more cautious forecasts. Seeing those side by side can make it easier for you to decide which story and valuation you find more reasonable.
Do you think there's more to the story for Hewlett Packard Enterprise? Head over to our Community to see what others are saying!

This article by Simply Wall St is general in nature. We provide commentary based on historical data and analyst forecasts only using an unbiased methodology and our articles are not intended to be financial advice. It does not constitute a recommendation to buy or sell any stock, and does not take account of your objectives, or your financial situation. We aim to bring you long-term focused analysis driven by fundamental data. Note that our analysis may not factor in the latest price-sensitive company announcements or qualitative material. Simply Wall St has no position in any stocks mentioned.
