
Please use a PC Browser to access Register-Tadawul
Get It
Is Hologic (HOLX) Pricing Reflect Its Cash Flow Strength After Recent Stability In Diagnostics?
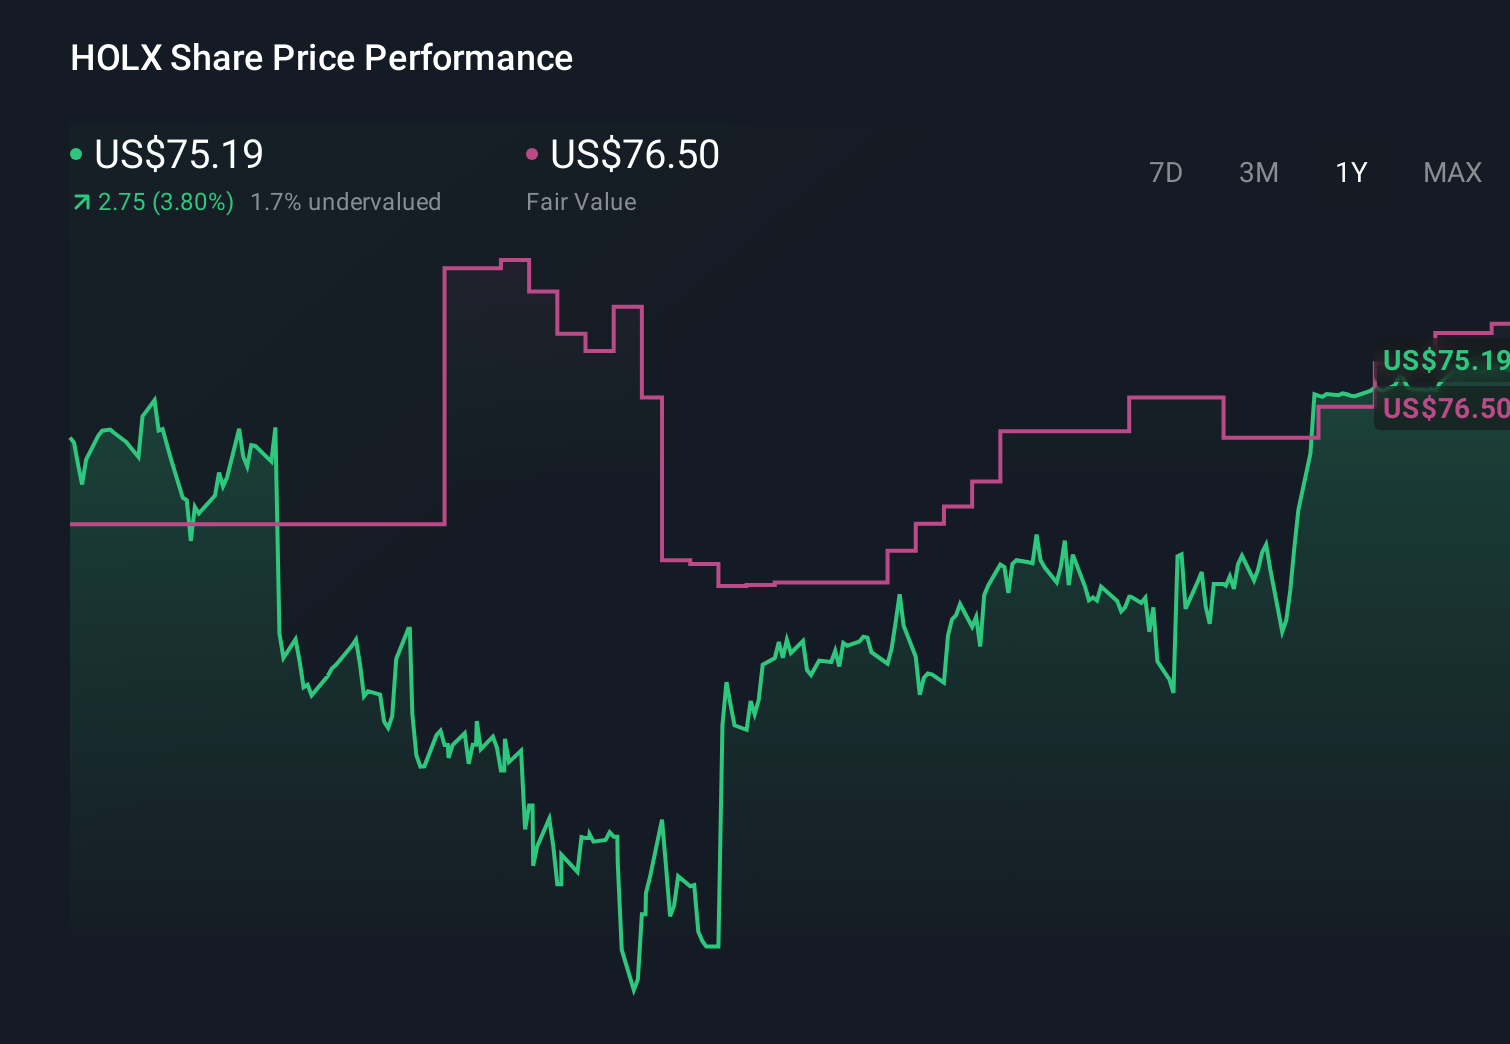
Hologic, Inc. HOLX | 75.43 | +0.39% |
A Discounted Cash Flow, or DCF, model takes estimates of the cash Hologic could generate in the future and discounts those amounts back to what they might be worth in today’s dollars. It is essentially asking what a stream of future cash flows is worth right now.
For Hologic, the model being used is a 2 Stage Free Cash Flow to Equity approach. The latest twelve month free cash flow (FCF) is about $942.7 million. Analysts have supplied some of the nearer term projections, and Simply Wall St extends those to build a ten year picture, with projected FCF of $1,519.5 million in 2035 based on the provided schedule of estimates and extrapolations.
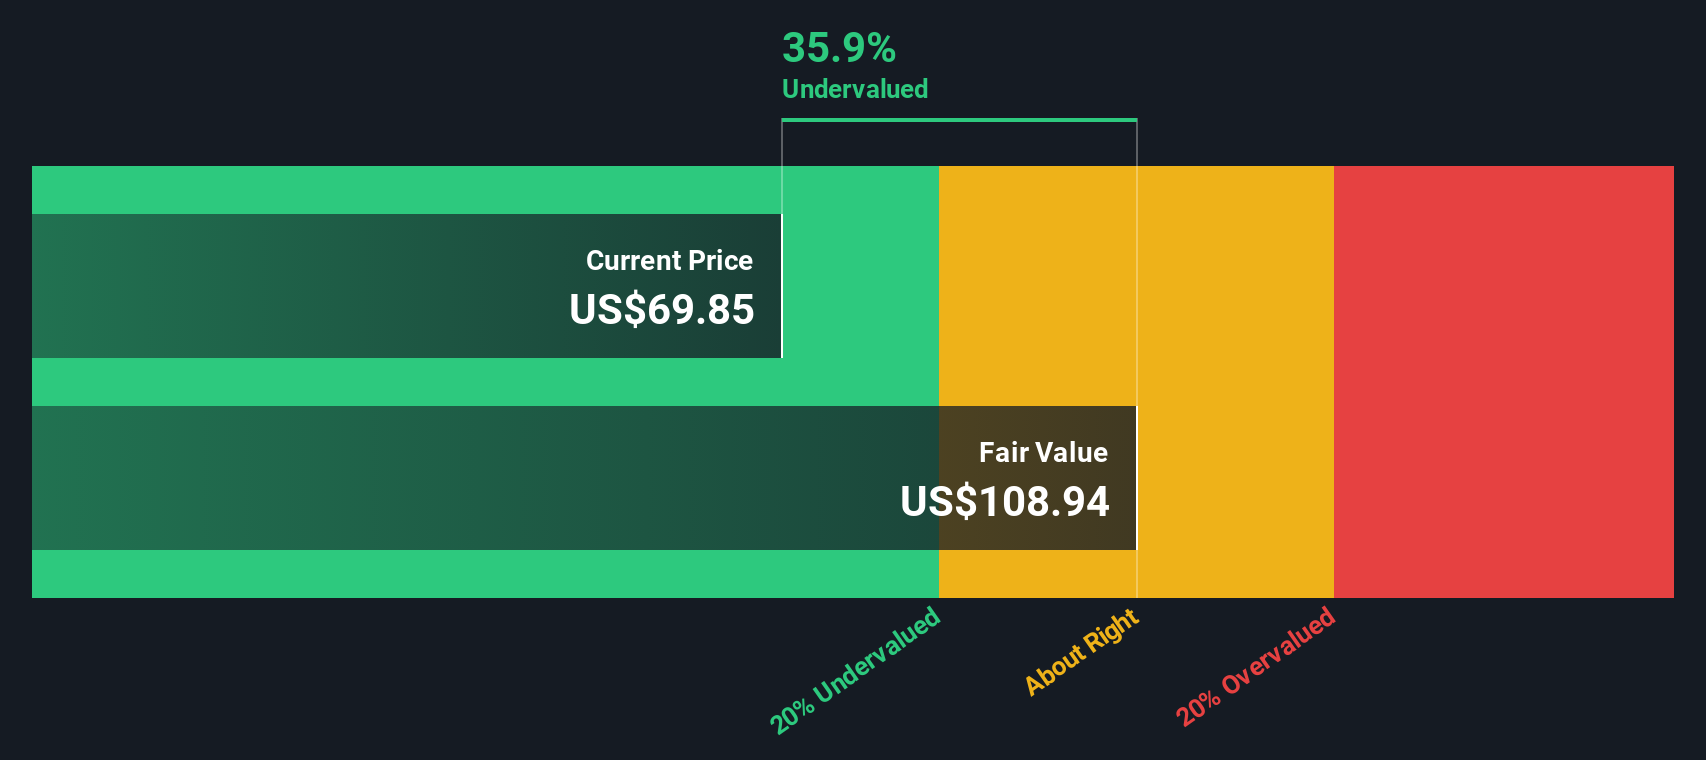
After discounting all those projected cash flows, the DCF model arrives at an estimated intrinsic value of US$109.05 per share. Compared with the recent share price of US$75.02, this output suggests Hologic trades at about a 31.2% discount. On this model alone, the stock appears to be trading below this estimate of intrinsic value.
Result: UNDERVALUED
Our Discounted Cash Flow (DCF) analysis suggests Hologic is undervalued by 31.2%. Track this in your watchlist or portfolio, or discover 52 more high quality undervalued stocks.
For profitable companies like Hologic, the P/E ratio is a straightforward way to gauge what investors are currently willing to pay for each dollar of earnings. It connects directly to your basic question: how much earnings power you are buying for today’s share price.
What counts as a “normal” or “fair” P/E depends on how the market views a company’s growth outlook and risk. Higher expected growth or lower perceived risk can justify a higher P/E, while slower growth or higher risk usually points to a lower multiple.
Hologic trades on a P/E of 30.80x. That sits below the Medical Equipment industry average of 33.20x and the peer average of 51.79x. Simply Wall St’s Fair Ratio for Hologic is 28.62x, which is the P/E level its model suggests based on factors like earnings growth, industry, profit margins, market cap and risk profile. This Fair Ratio can be more useful than simple peer or industry comparisons because it is tailored to the company rather than assuming all firms deserve similar multiples.
Compared with this Fair Ratio of 28.62x, Hologic’s current P/E of 30.80x points to a stock that screens as slightly overvalued on this measure.
Result: OVERVALUED

P/E ratios tell one story, but what if the real opportunity lies elsewhere? Start investing in legacies, not executives. Discover our 22 top founder-led companies.
Earlier we mentioned that there is an even better way to understand valuation. On Simply Wall St's Community page you can use Narratives to set out your own story for Hologic, link that story to specific forecasts for revenue, earnings and margins, translate those into a Fair Value you can compare with the current price when deciding whether to act, and see it all update automatically as new news or earnings arrive. This is why one investor might build a more optimistic Hologic Narrative around the higher US$94.0 analyst target while another leans on the lower US$65.0 view, with both grounded in the same shared data but reflecting different expectations and risk comfort.
Do you think there's more to the story for Hologic? Head over to our Community to see what others are saying!
This article by Simply Wall St is general in nature. We provide commentary based on historical data and analyst forecasts only using an unbiased methodology and our articles are not intended to be financial advice. It does not constitute a recommendation to buy or sell any stock, and does not take account of your objectives, or your financial situation. We aim to bring you long-term focused analysis driven by fundamental data. Note that our analysis may not factor in the latest price-sensitive company announcements or qualitative material. Simply Wall St has no position in any stocks mentioned.
