
Please use a PC Browser to access Register-Tadawul
Get It
Is IQVIA (IQV) Offering Value After Strong Gains And Healthcare Data Tailwinds?
IQVIA Holdings Inc IQV | 230.15 | -2.32% |
A Discounted Cash Flow model takes the cash a company is expected to generate in the future and then discounts those amounts back to what they could be worth to you in $ today.
For IQVIA Holdings, the latest twelve month Free Cash Flow is about $2.17b. Analysts have provided explicit forecasts out to 2030, and Simply Wall St extrapolates beyond the initial analyst horizon to build a 2 stage Free Cash Flow to Equity model, with projected Free Cash Flow of $3.15b in 2030.
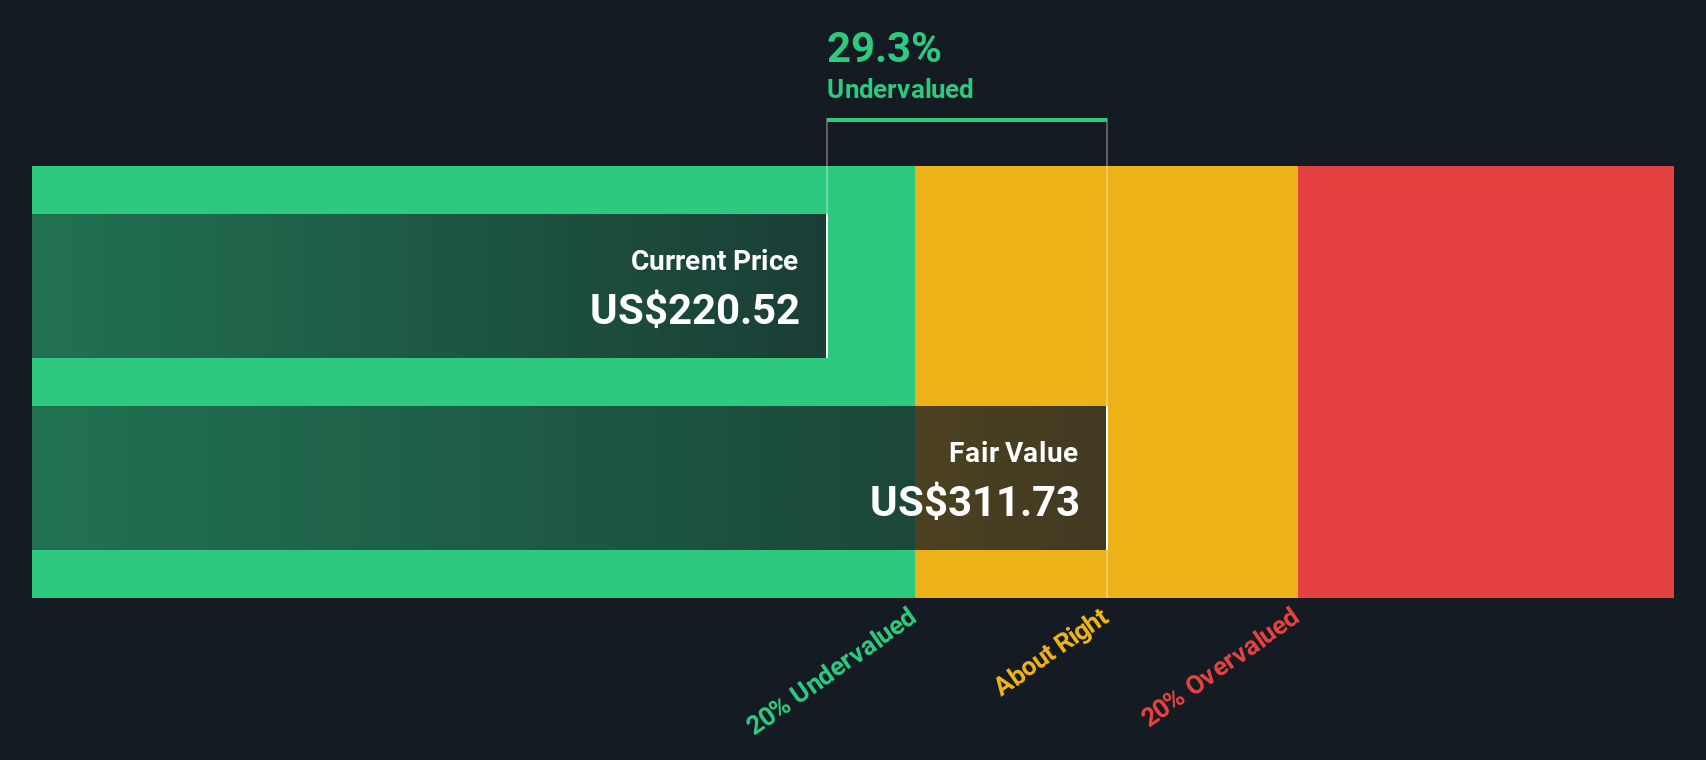
Using these cash flow projections, the model arrives at an estimated intrinsic value of $320.12 per share. Compared with the recent share price of $239.05, the DCF output suggests the shares trade at a 25.3% discount to this estimate, which points to IQVIA being undervalued on this methodology.
This is only one model and it depends heavily on the cash flow assumptions used, but it does indicate there could be a valuation gap in your favor at current levels.
Result: UNDERVALUED
Our Discounted Cash Flow (DCF) analysis suggests IQVIA Holdings is undervalued by 25.3%. Track this in your watchlist or portfolio, or discover 880 more undervalued stocks based on cash flows.
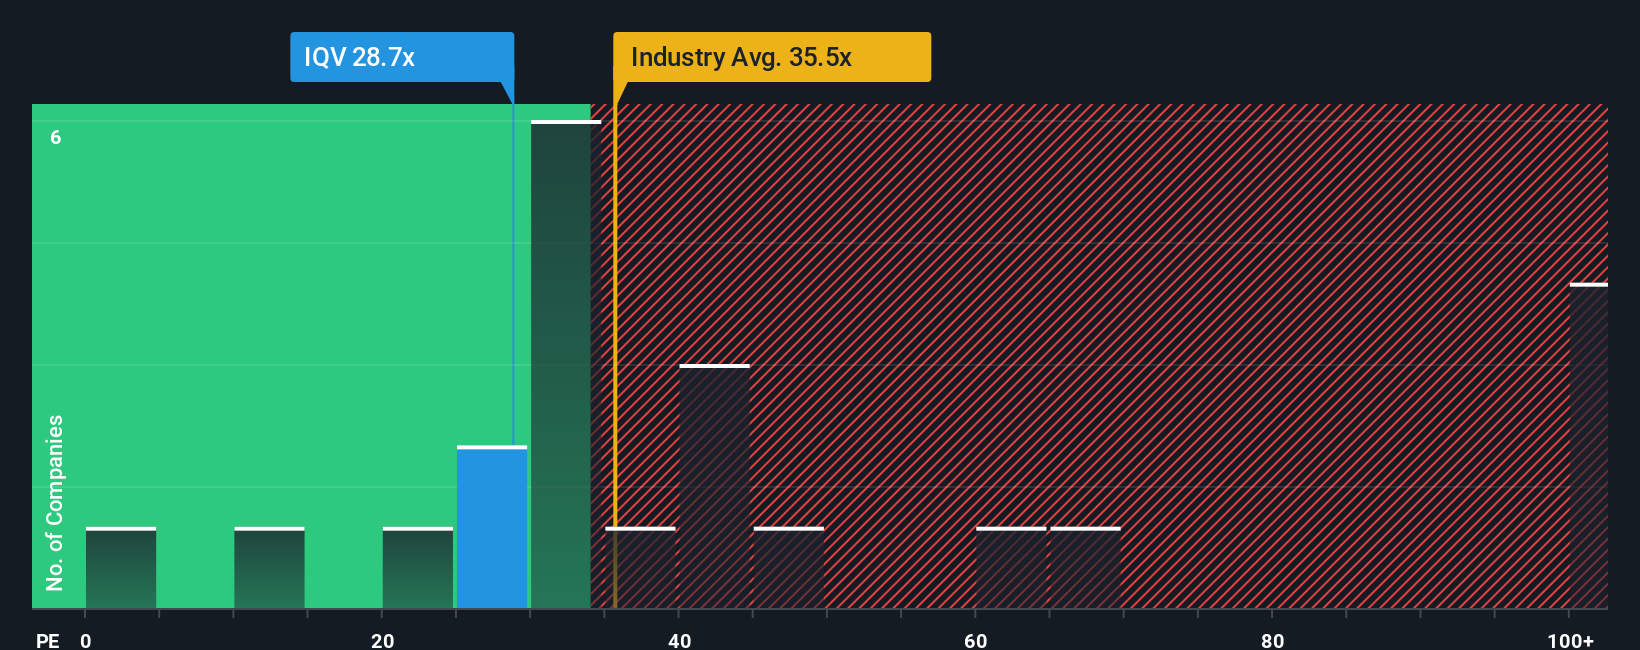
For a profitable company like IQVIA, the P/E ratio is a useful way to think about what you are paying for each dollar of current earnings. It links directly to the bottom line, which is usually what ultimately matters for equity holders.
What counts as a “normal” or “fair” P/E depends on how the market views a company’s growth potential and risk. Higher expected growth or lower perceived risk can support a higher P/E, while slower growth or higher risk can justify a lower one.
IQVIA currently trades on a P/E of 31.73x. That sits below the Life Sciences industry average P/E of 37.69x and below the peer group average of 33.88x. Simply Wall St also calculates a proprietary “Fair Ratio” of 25.73x, which is the P/E level it estimates for IQVIA after factoring in elements such as earnings growth, profit margins, industry, market value and key risks.
This Fair Ratio aims to be more tailored than a simple comparison with peers or the sector because it adjusts for IQVIA’s own characteristics rather than assuming every company in the group should trade on the same multiple. Comparing the current P/E of 31.73x with the Fair Ratio of 25.73x suggests the shares are pricing in more optimism than that model would imply.
Result: OVERVALUED
P/E ratios tell one story, but what if the real opportunity lies elsewhere? Discover 1427 companies where insiders are betting big on explosive growth.
Earlier we mentioned that there is an even better way to think about valuation, so let us introduce you to Narratives, which are simply your story about a company, linked directly to your assumptions about fair value, future revenue, earnings and margins.
On Simply Wall St, a Narrative connects what you believe is happening with IQVIA Holdings to a financial forecast, then to a Fair Value estimate that you can compare with the current share price to decide whether the stock looks attractive or expensive to you.
You do not need to build a spreadsheet, because the Narrative tools on the Community page let you adjust key inputs in a visual way, and the Fair Value and other metrics update automatically when new information like news or earnings is added.
For example, one IQVIA Holdings Narrative might assume higher revenue growth and a stronger profit margin, leading to a higher Fair Value, while another might assume more moderate revenue growth and a lower margin, leading to a lower Fair Value. Seeing those different stories side by side can help you decide which one feels more reasonable and how that compares to today’s US$239.05 share price.
Do you think there's more to the story for IQVIA Holdings? Head over to our Community to see what others are saying!
This article by Simply Wall St is general in nature. We provide commentary based on historical data and analyst forecasts only using an unbiased methodology and our articles are not intended to be financial advice. It does not constitute a recommendation to buy or sell any stock, and does not take account of your objectives, or your financial situation. We aim to bring you long-term focused analysis driven by fundamental data. Note that our analysis may not factor in the latest price-sensitive company announcements or qualitative material. Simply Wall St has no position in any stocks mentioned.
