Is It Time To Reassess Alibaba (BABA) After Its 111% One Year Share Price Surge
Alibaba Group Holding Ltd. Sponsored ADR BABA | 0.00 |
- If you are wondering whether Alibaba Group Holding's current share price reflects its true value, you are not alone. This article is built to help you frame that question clearly.
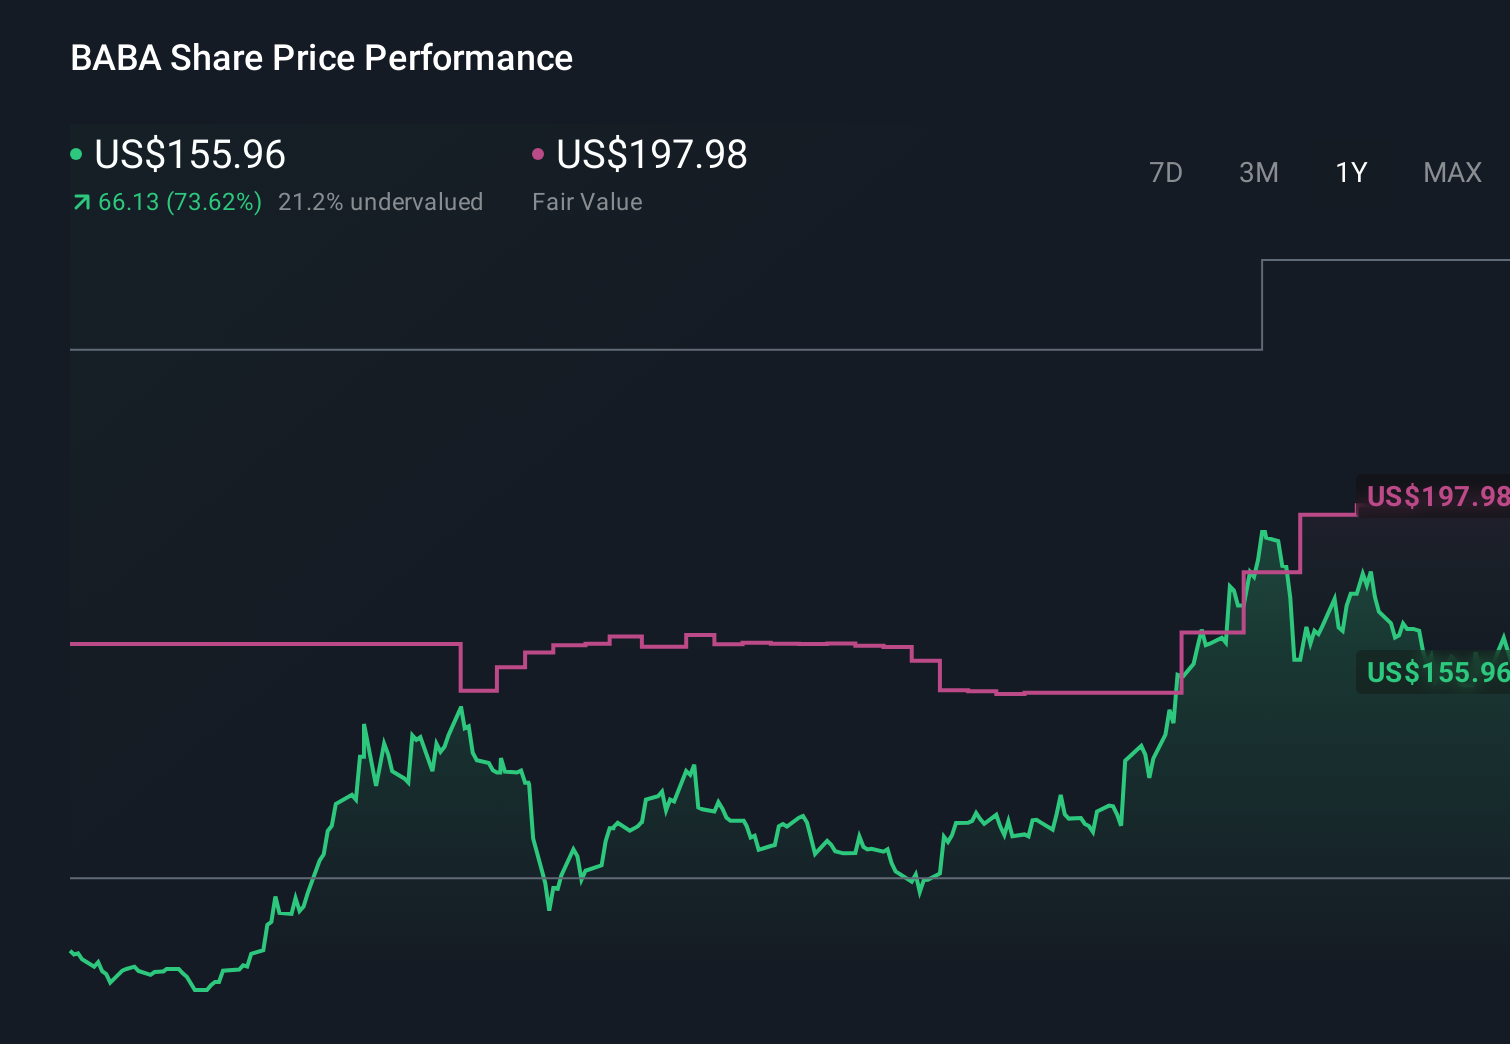
- The stock last closed at US$170.93, with returns of 10.7% over 7 days, 14.5% over 30 days, 9.8% year to date, 110.8% over 1 year and 54.3% over 3 years. The 5 year return sits at a 30.8% decline.
- Recent news around Alibaba has focused on its position as one of China's major e commerce and cloud players, alongside ongoing attention on large Chinese technology groups in US markets. Headlines have often centered on regulatory conditions in China and how global investors interpret the long term prospects for these platforms.
- Simply Wall St currently gives Alibaba Group Holding a valuation score of 4 out of 6. Next we will walk through what different valuation approaches say about that number, before finishing with a way to think about valuation that can give you an even clearer picture.
Approach 1: Alibaba Group Holding Discounted Cash Flow (DCF) Analysis
A Discounted Cash Flow, or DCF, model takes estimates of the cash a company may generate in the future, then discounts those amounts back to what they could be worth today.
For Alibaba Group Holding, the model used here is a 2 Stage Free Cash Flow to Equity approach, based on cash flows reported in CN¥. The latest twelve month free cash flow is CN¥50.9b. Analysts provide explicit free cash flow estimates for the next several years, and Simply Wall St then extends those projections further out using its own assumptions.
Those projections point to free cash flow around CN¥423.6b in year ten, after passing through the intermediate yearly steps in the model. When all of those future cash flows are discounted back and combined, the DCF output suggests an estimated intrinsic value of US$281.17 per share.
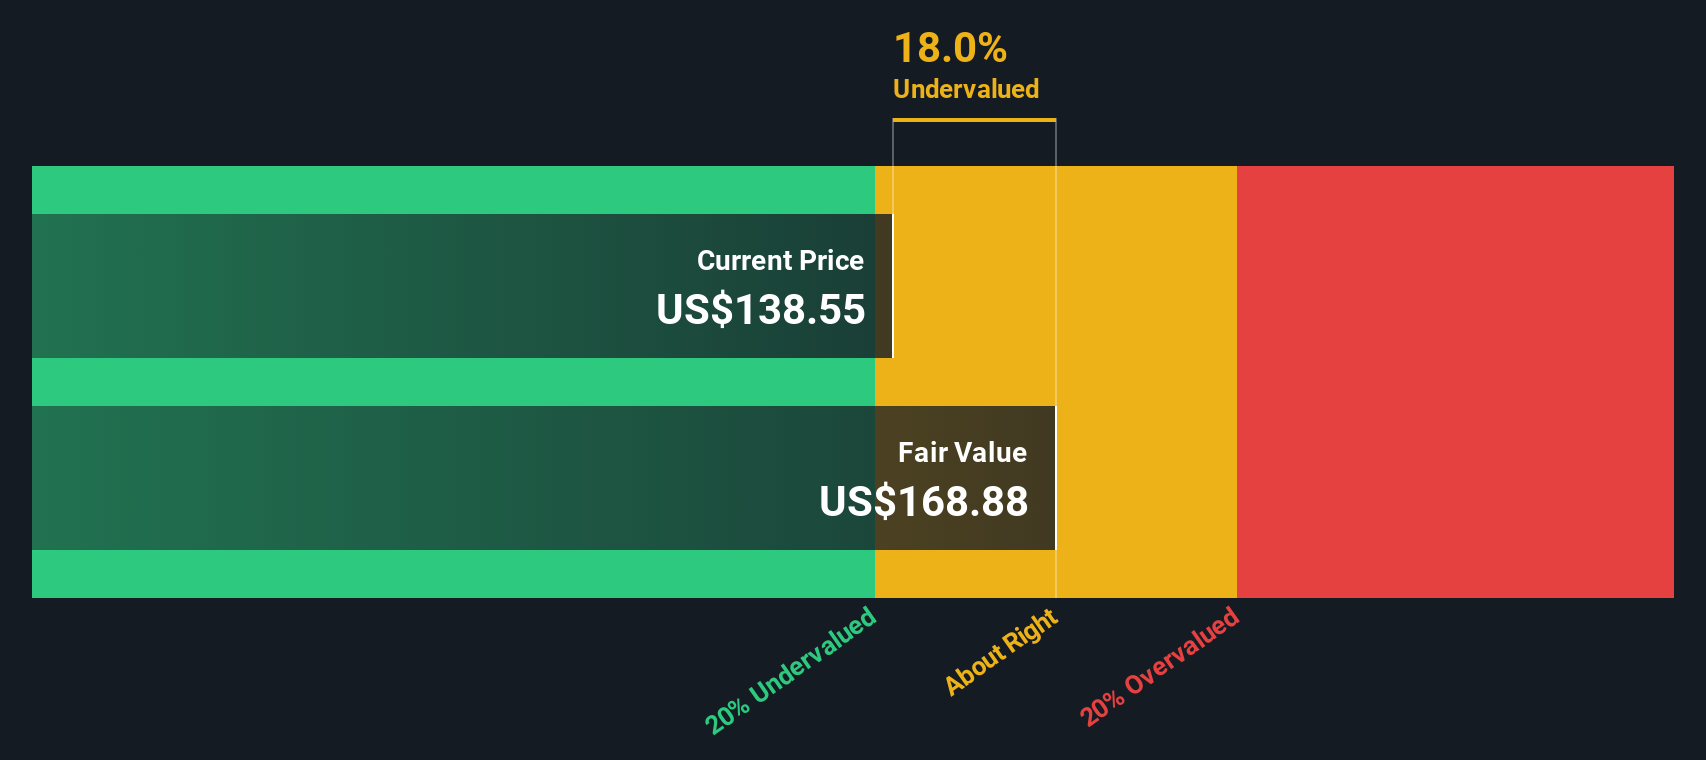
Compared with the recent share price of US$170.93, that estimate implies the stock is 39.2% undervalued on this model.
Result: UNDERVALUED
Our Discounted Cash Flow (DCF) analysis suggests Alibaba Group Holding is undervalued by 39.2%. Track this in your watchlist or portfolio, or discover 868 more undervalued stocks based on cash flows.
Approach 2: Alibaba Group Holding Price vs Earnings
For profitable companies, the P/E ratio is a useful way to link what you pay for each share to the earnings that business is currently generating. It helps you see how many dollars of share price the market is attaching to each dollar of earnings.
What counts as a “normal” P/E depends a lot on how the market views growth potential and risk. Higher expected earnings growth or lower perceived risk can support a higher P/E, while lower growth expectations or higher risk usually point to a lower multiple.
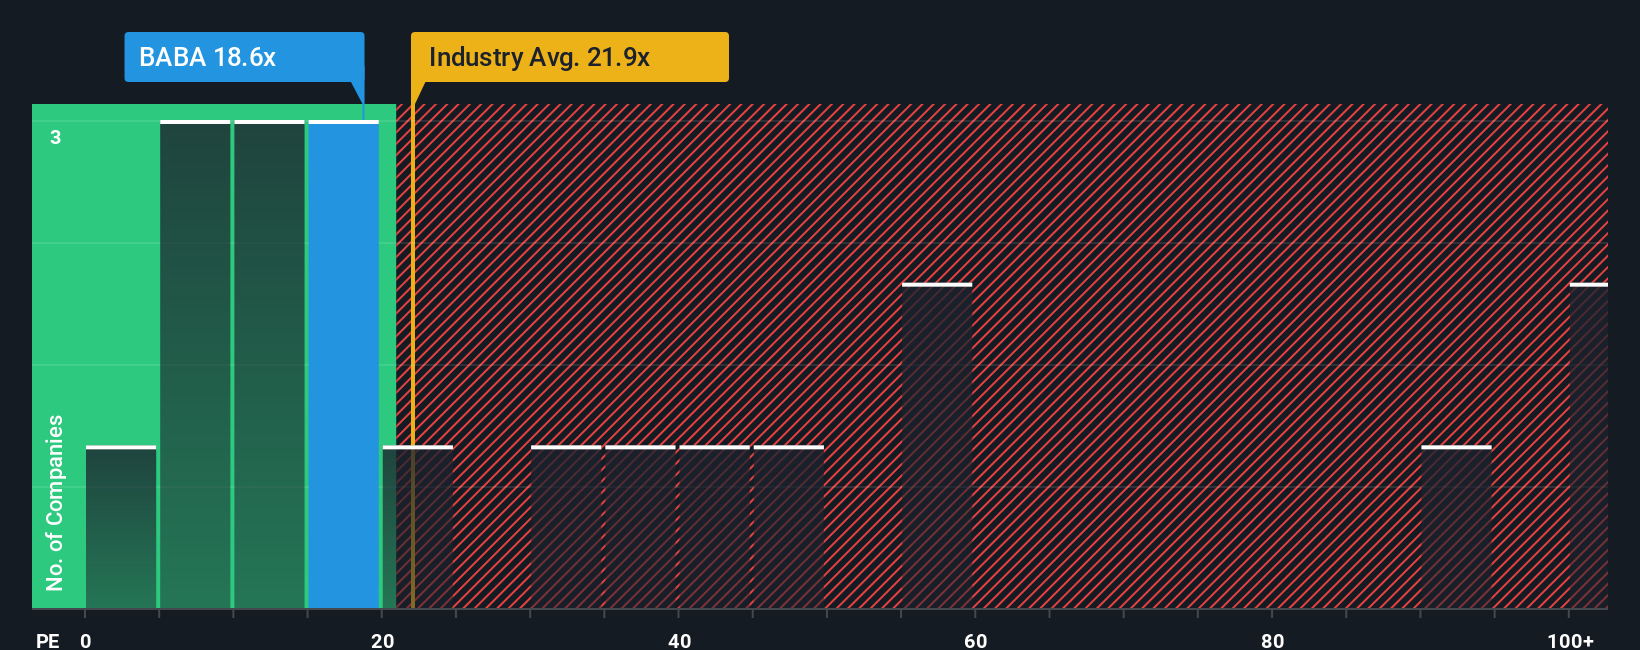
Alibaba Group Holding currently trades on a P/E of 21.22x. That sits above the Multiline Retail industry average of 19.77x, but below the peer group average of 30.60x. Simply Wall St also calculates a proprietary “Fair Ratio” for Alibaba of 29.81x. This Fair Ratio is designed to reflect the P/E you might expect given factors such as earnings growth, profit margins, industry, market cap and specific risk characteristics, rather than just a broad peer or industry comparison.
Because the Fair Ratio of 29.81x is higher than the current P/E of 21.22x, this approach suggests Alibaba Group Holding may be trading below the level implied by those fundamentals.
Result: UNDERVALUED
P/E ratios tell one story, but what if the real opportunity lies elsewhere? Discover 1440 companies where insiders are betting big on explosive growth.
Upgrade Your Decision Making: Choose your Alibaba Group Holding Narrative
Earlier we mentioned that there is an even better way to understand valuation, so let us introduce you to Narratives, a simple tool on Simply Wall St's Community page where you turn your view of Alibaba Group Holding into a story that connects your assumptions about future revenue, earnings and margins to a financial forecast, a fair value, and a clear comparison with today’s price. All of this then updates automatically when new news or earnings arrive. One investor might build a cautious Alibaba Narrative with a fair value around US$107.09 that highlights trade and regulatory risks and questions around recent selling. Another might create a more optimistic Narrative with a fair value near US$195.12 that leans on cloud, AI and quick commerce potential. Seeing those side by side helps you decide whether the current share price looks high, low or about right for the story you personally find most convincing.
For Alibaba Group Holding, here are previews of two leading Alibaba Group Holding Narratives that make it easier to compare different perspectives:
These are examples of how different investors are joining the dots between the same set of data and reaching very different views on what the shares are worth today.
Fair value in this Narrative: US$195.12
Gap to this fair value vs the last close of US$170.93: around 12.4% below that fair value estimate.
Revenue growth assumption in this Narrative: 9.31% a year.
- Sees long term earnings power being built around heavy investment in AI, cloud and quick commerce, with Alibaba aiming to widen its role in digital services for both consumers and enterprises.
- Assumes revenue rising to CN¥1,260.3b and earnings to CN¥171.1b by 2028, with a 19.5x P/E on those earnings and a 9.1% discount rate used to translate those forecasts into a fair value today.
- Flags meaningful risks around margin pressure, high capital spending, competitive quick commerce markets, and regulation, but still views the current price as below the level implied by those forecasts.
Fair value in this Narrative: US$107.09
Gap to this fair value vs the last close of US$170.93: around 59.7% above that fair value estimate.
Revenue growth assumption in this Narrative: 14.12% a year.
- Uses a DCF built on US$15b of free cash flow, a 9.4% cost of equity, and growth starting at 8% and moderating to 2.5%, which produces a fair value of US$107.09 per share.
- Highlights external risks such as US China trade tensions, regulation of Chinese tech, competition in cloud and AI, and currency moves as key constraints on how much investors may want to pay.
- Accepts that Alibaba has strong positions in e commerce and cloud with solid cash generation, but views the current share price as already baking in those positives given the macro and geopolitical backdrop.
Looking at the two side by side, you can see how reasonable differences in assumptions around growth, margins, required returns and risk can lead to very different fair values. The key question is which story is closer to how you see Alibaba Group Holding over the next few years.
Do you think there's more to the story for Alibaba Group Holding? Head over to our Community to see what others are saying!
This article by Simply Wall St is general in nature. We provide commentary based on historical data and analyst forecasts only using an unbiased methodology and our articles are not intended to be financial advice. It does not constitute a recommendation to buy or sell any stock, and does not take account of your objectives, or your financial situation. We aim to bring you long-term focused analysis driven by fundamental data. Note that our analysis may not factor in the latest price-sensitive company announcements or qualitative material. Simply Wall St has no position in any stocks mentioned.