Is It Time To Reassess Appian (APPN) After Prolonged Share Price Weakness?
Appian APPN | 24.54 24.54 | +0.29% 0.00% Pre |
- If you are wondering whether Appian's current share price reflects its underlying worth, you are not alone. Many investors are asking the same question right now.
- The stock recently closed at US$30.21, with returns of 6.3% over the last 7 days, a 15.3% decline over 30 days, an 11.3% decline year to date, a 14.2% decline over 1 year and a 30.5% decline over 3 years, while the 5 year return stands at an 85.4% decline.
- Recent company news has focused on Appian's position in low code software and its efforts to strengthen its platform offering, giving investors more context for the recent share price moves. These updates have kept attention on how the market is currently weighing the risks and potential of Appian's business model.
- On Simply Wall St's valuation checks, Appian scores 3 out of 6. This means it screens as undervalued on half of the key measures. You can see the breakdown in this valuation score, and we will walk through those methods next, before finishing with a way to think about valuation that goes beyond any single model.
Approach 1: Appian Discounted Cash Flow (DCF) Analysis
A Discounted Cash Flow, or DCF, model estimates what a company might be worth by projecting its future cash flows and then discounting them back to today using a required return. It is essentially asking what future cash generated by the business is worth in present dollars.
For Appian, Simply Wall St uses a 2 Stage Free Cash Flow to Equity model based on cash flow projections in US$. The latest twelve month free cash flow is shown as $68.32 million. Analysts provide estimates out to 2027, with projected free cash flow of $94.92 million in that year. Beyond that, the model extrapolates out to 2035, with discounted free cash flow figures ranging from about $62.34 million in 2026 to $66.97 million in 2035.
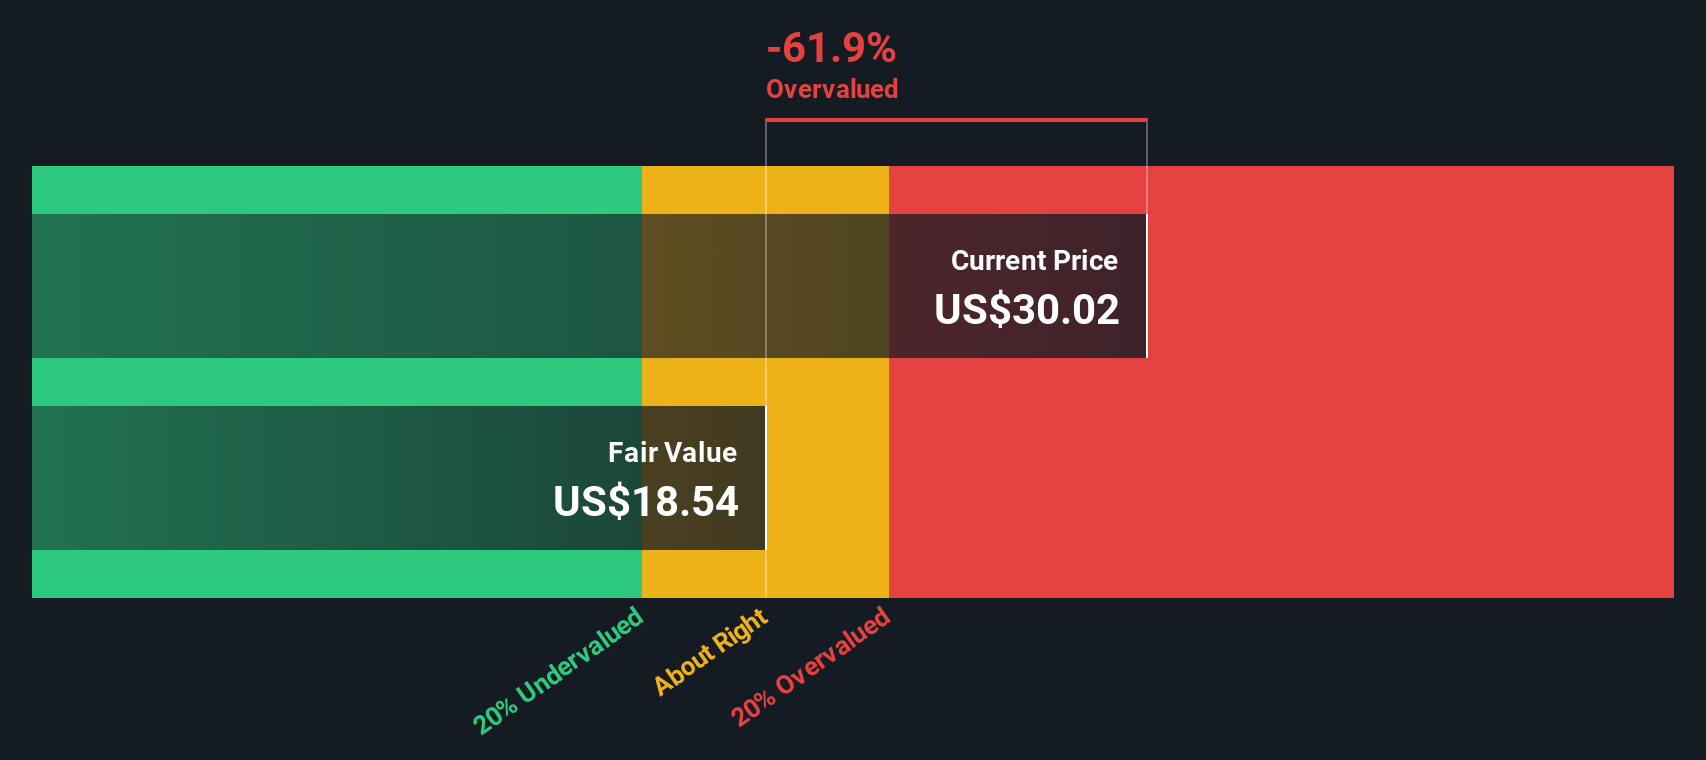
Aggregating these discounted cash flows gives an estimated intrinsic value of $27.11 per share, compared with the recent share price of $30.21. That implies the shares are about 11.4% overvalued on this DCF view.
Result: OVERVALUED
Our Discounted Cash Flow (DCF) analysis suggests Appian may be overvalued by 11.4%. Discover 875 undervalued stocks or create your own screener to find better value opportunities.
Approach 2: Appian Price vs Sales
For companies where earnings are not a clean guide, the P/S ratio is often a more useful yardstick because it compares the share price to the revenue the business is generating, rather than to profits that may be volatile or negative.
What counts as a normal or fair P/S ratio will usually reflect how fast investors expect revenue to grow and how much risk they see in those expectations. Higher expected growth and lower perceived risk often go with a higher multiple, while slower growth or higher uncertainty can pull that multiple down.
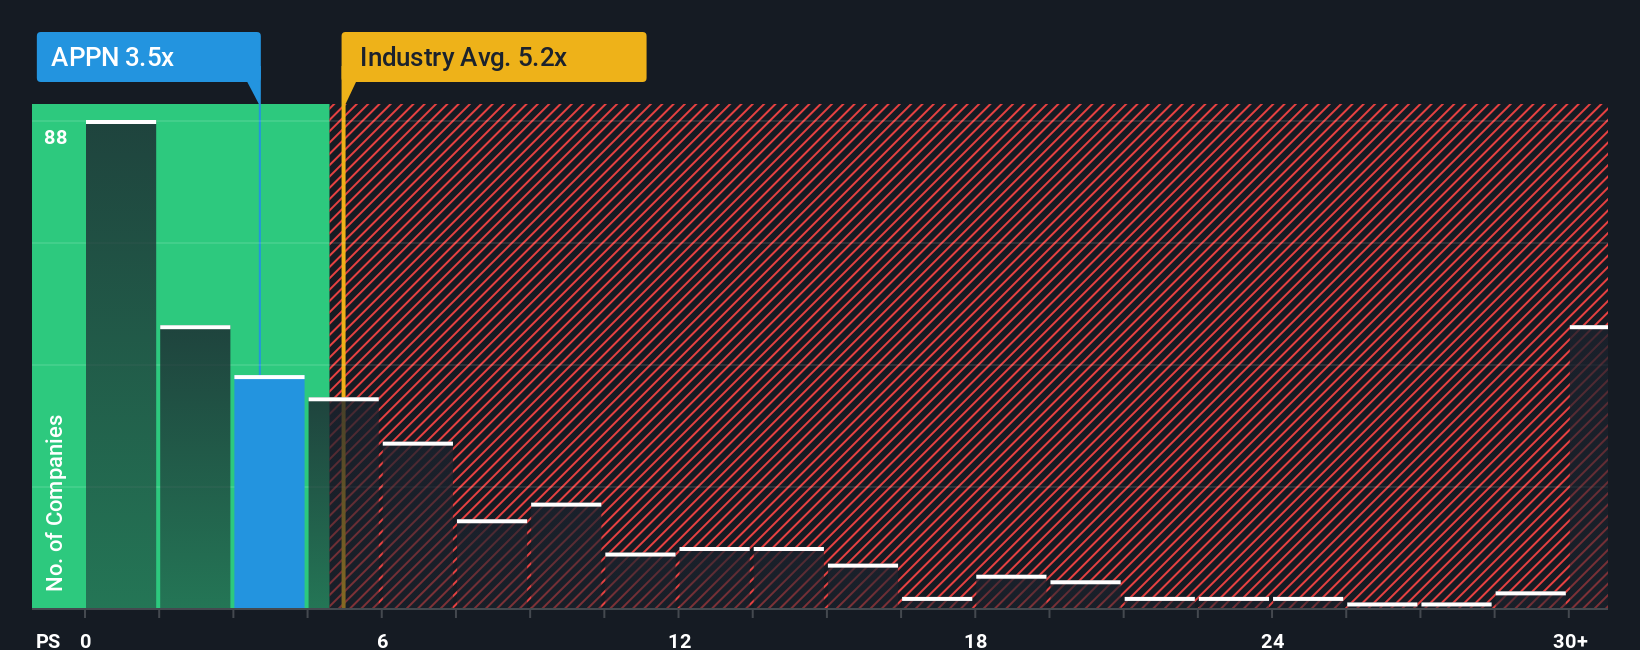
Appian currently trades on a P/S ratio of 3.23x. That sits below the Software industry average of 4.54x and modestly above the peer average of 2.88x. Simply Wall St also calculates a Fair Ratio of 4.36x for Appian. This Fair Ratio is a proprietary estimate of what the P/S might be, given factors such as the company’s growth profile, profit margins, industry, market cap and risk characteristics. It gives a more tailored view than a simple comparison against peers or the broad industry.
With the current P/S of 3.23x sitting below the Fair Ratio of 4.36x, the shares screen as undervalued on this P/S framework.
Result: UNDERVALUED
P/S ratios tell one story, but what if the real opportunity lies elsewhere? Discover 1417 companies where insiders are betting big on explosive growth.
Upgrade Your Decision Making: Choose your Appian Narrative
Earlier we mentioned that there is an even better way to understand valuation, so let us introduce you to Narratives, which help you connect your view of Appian’s story to the numbers behind it. A Narrative is simply your own storyline for the company, where you set assumptions for future revenue, earnings and margins, then link those to a fair value estimate that you can compare with the current share price. On Simply Wall St, Narratives sit inside the Community page, where millions of investors use them as an accessible tool to see whether their Fair Value suggests the stock might be priced attractively or not right now. Narratives are updated when new information like news or earnings is added, so your fair value view can adjust as the facts change. For example, one Appian Narrative might assume stronger revenue growth and higher future margins that point to a higher fair value, while another might use more conservative growth and profitability assumptions that result in a lower fair value.
Do you think there's more to the story for Appian? Head over to our Community to see what others are saying!

This article by Simply Wall St is general in nature. We provide commentary based on historical data and analyst forecasts only using an unbiased methodology and our articles are not intended to be financial advice. It does not constitute a recommendation to buy or sell any stock, and does not take account of your objectives, or your financial situation. We aim to bring you long-term focused analysis driven by fundamental data. Note that our analysis may not factor in the latest price-sensitive company announcements or qualitative material. Simply Wall St has no position in any stocks mentioned.