
Please use a PC Browser to access Register-Tadawul
Get It
Is It Time To Reassess CorMedix (CRMD) After The Sharp Recent Share Price Slide
CorMedix Inc. CRMD | 7.03 | -0.71% |
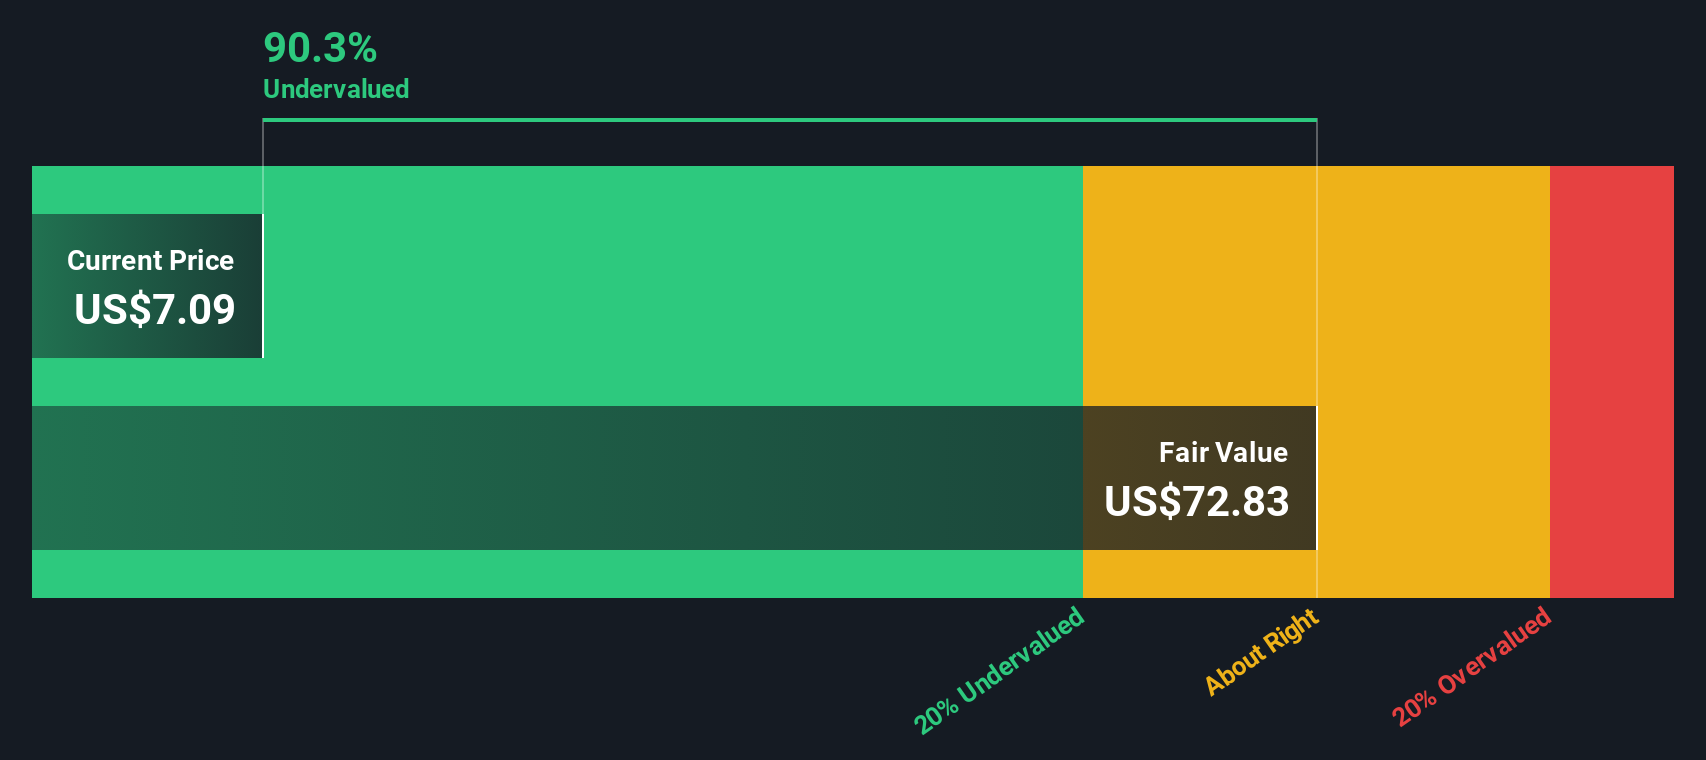
The DCF model estimates what CorMedix could be worth today by projecting its future cash flows and then discounting those projections back to a present value using a required rate of return.
For CorMedix, Simply Wall St uses a 2 stage Free Cash Flow to Equity model. The latest twelve month free cash flow is reported at about $73.9 million. Analyst inputs cover several years ahead, with free cash flow projections, for example, of $225.8 million in 2026 and $241.8 million in 2030. Beyond the analyst horizon, Simply Wall St extrapolates the cash flows to complete a 10 year path using its own assumptions.
When all those projected cash flows are discounted back, the model arrives at an estimated intrinsic value of about $72.83 per share. Compared with the recent share price of US$7.09, this implies a 90.3% discount. On this particular set of cash flow assumptions, the shares screen as heavily undervalued.
Result: UNDERVALUED
Our Discounted Cash Flow (DCF) analysis suggests CorMedix is undervalued by 90.3%. Track this in your watchlist or portfolio, or discover 884 more undervalued stocks based on cash flows.
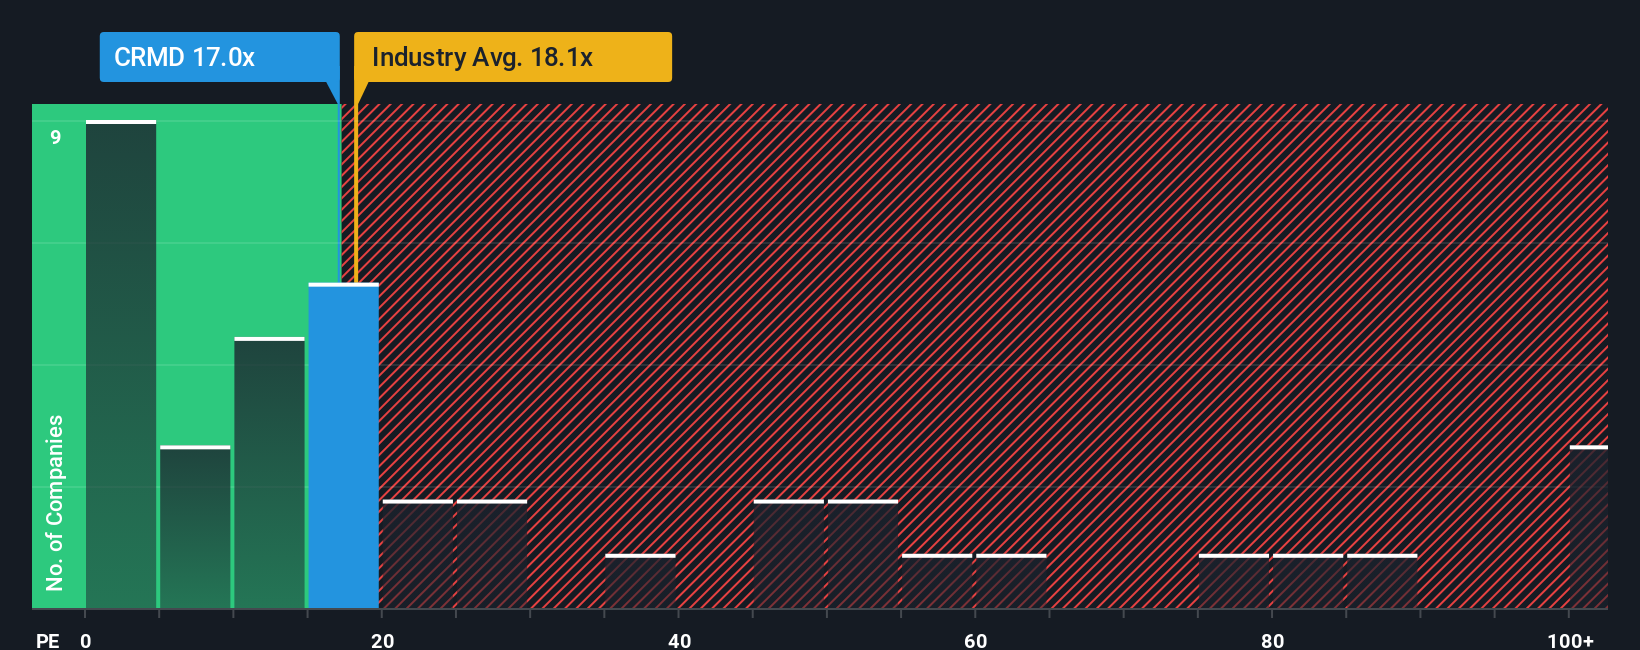
For a company that is generating earnings, the P/E ratio is a straightforward way to check what you are paying for each dollar of profit. It lets you compare CorMedix with other profitable businesses in the same space using a common yardstick.
What counts as a "normal" or "fair" P/E depends on how the market views a company’s growth prospects and risk. Higher expected growth or lower perceived risk can support a higher P/E, while slower expected growth or higher risk usually goes with a lower P/E.
CorMedix currently trades on a P/E of 3.44x. That sits well below the Pharmaceuticals industry average P/E of 20.49x and also below the peer group average of 16.15x. Simply Wall St’s Fair Ratio for CorMedix is 15.73x, which is its proprietary view of what the P/E might be given factors such as earnings growth, industry, profit margins, market cap and key risks. This Fair Ratio can be more tailored than a simple comparison against peers or the broad industry because it attempts to adjust for those company specific characteristics.
Comparing the current P/E of 3.44x with the Fair Ratio of 15.73x, the shares appear undervalued on this metric.
Result: UNDERVALUED on this metric
P/E ratios tell one story, but what if the real opportunity lies elsewhere? Discover 1440 companies where insiders are betting big on explosive growth.
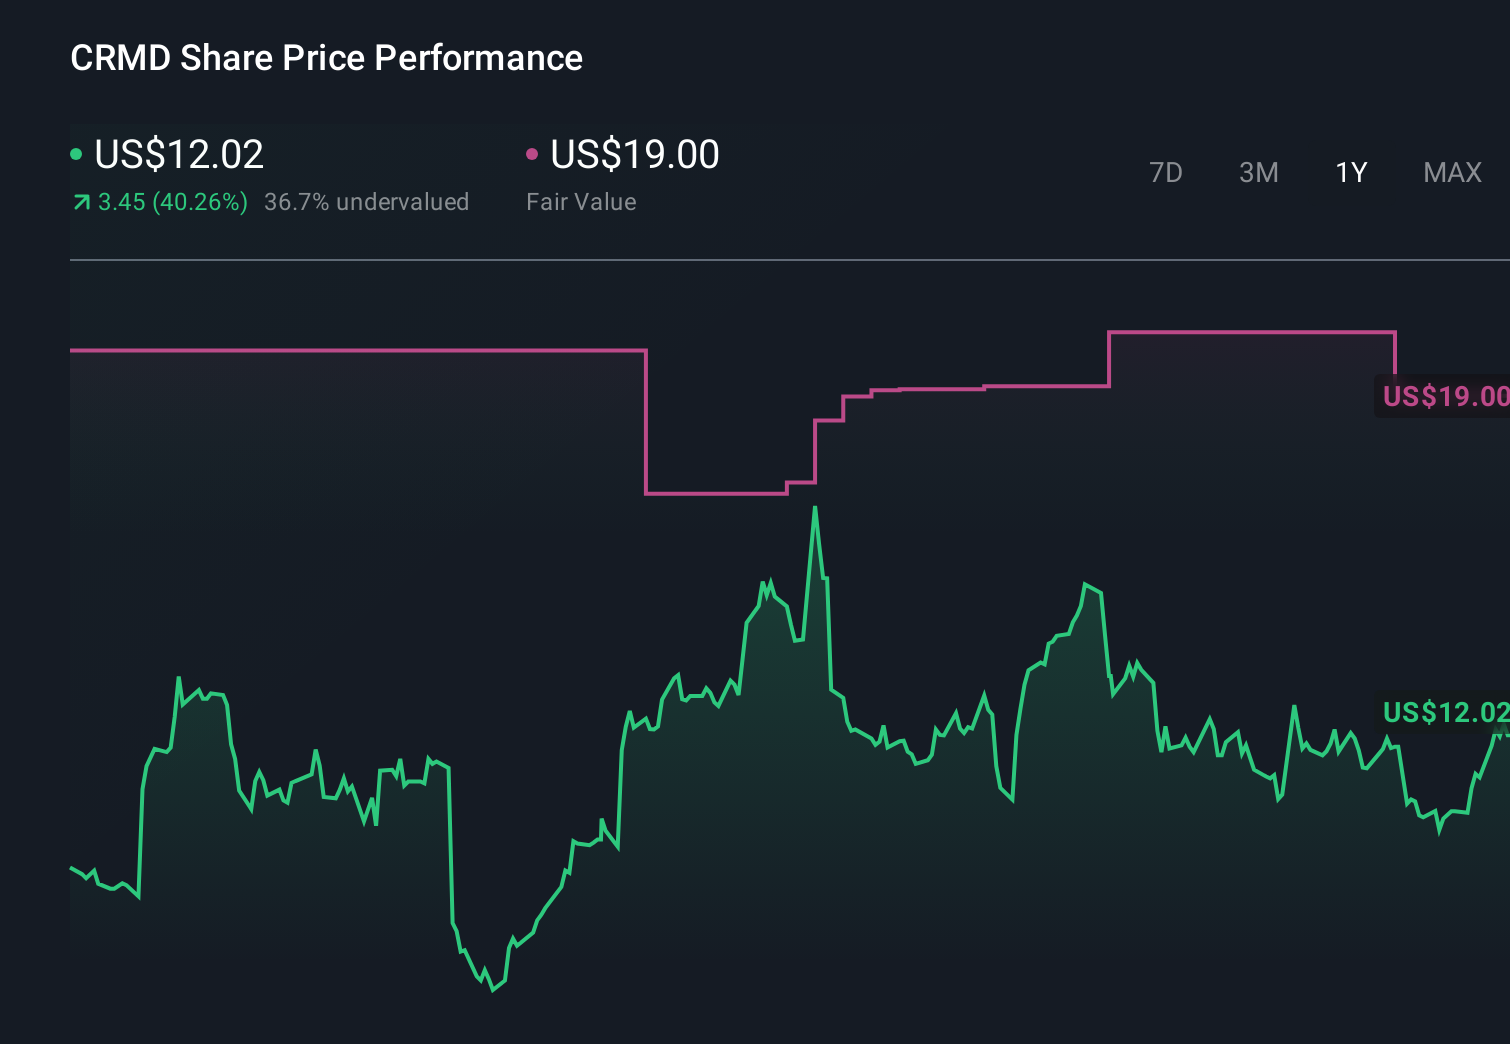
Earlier we mentioned that there is an even better way to understand valuation. On Simply Wall St's Community page you can use Narratives, where you set out your story for CorMedix, link that story to your own assumptions for future revenue, earnings, margins and fair value, see how that fair value compares with the current share price to help you decide if you might want to buy or sell, and watch it update automatically when new information like earnings or news comes in. One investor might build a CorMedix Narrative around the current US$19 fair value figure and recent US$14 price target, while someone more cautious could lean toward the lower analyst targets or earnings expectations to arrive at a different fair value and decision.
Do you think there's more to the story for CorMedix? Head over to our Community to see what others are saying!
This article by Simply Wall St is general in nature. We provide commentary based on historical data and analyst forecasts only using an unbiased methodology and our articles are not intended to be financial advice. It does not constitute a recommendation to buy or sell any stock, and does not take account of your objectives, or your financial situation. We aim to bring you long-term focused analysis driven by fundamental data. Note that our analysis may not factor in the latest price-sensitive company announcements or qualitative material. Simply Wall St has no position in any stocks mentioned.
