
Please use a PC Browser to access Register-Tadawul
Get It
Is It Time To Reassess KB Home (KBH) After Mixed Returns And Housing Market Headlines
KB Home KBH | 65.30 | +0.76% |
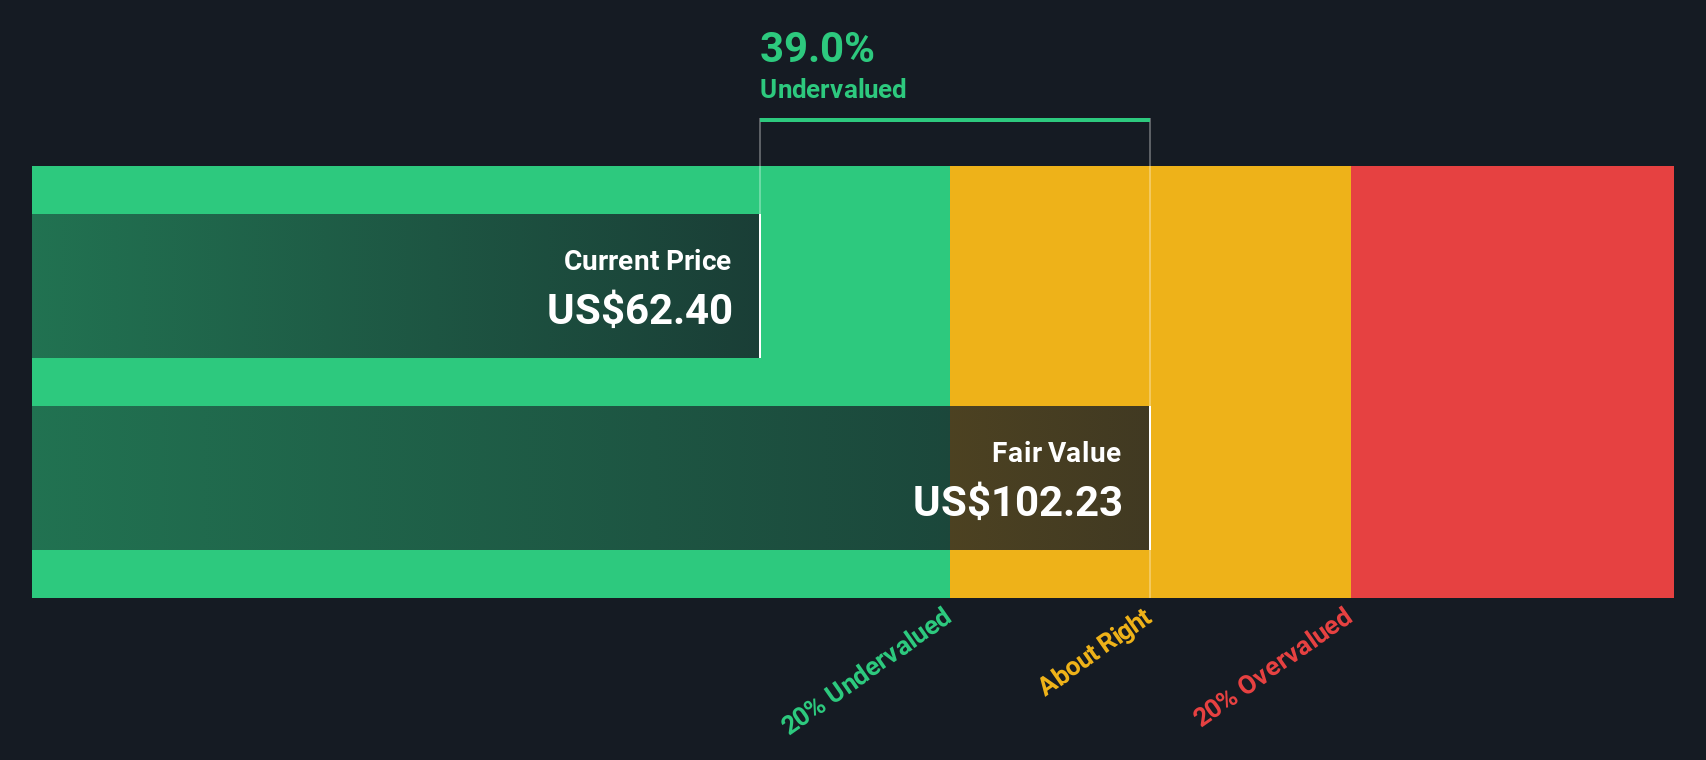
A Discounted Cash Flow model estimates what a business could be worth by projecting its future cash flows and discounting them back to today, so you can compare that value with the current share price.
For KB Home, the 2 Stage Free Cash Flow to Equity model starts with last twelve months free cash flow of about $296.4 million. Analysts provide explicit forecasts out to 2027, including a projected free cash flow of $186.0 million in 2027. Beyond that, Simply Wall St extrapolates further, with ten year projections that run through 2035, all expressed in $. Each of those future cash flows is discounted back, then summed to arrive at an estimated intrinsic value per share.
On this basis, the model suggests a fair value of about $36.00 per share, which implies KB Home is around 69.3% overvalued compared with the recent share price of US$60.94. On these cash flow assumptions, the current market price sits well above the DCF estimate.
Result: OVERVALUED
Our Discounted Cash Flow (DCF) analysis suggests KB Home may be overvalued by 69.3%. Discover 52 high quality undervalued stocks or create your own screener to find better value opportunities.
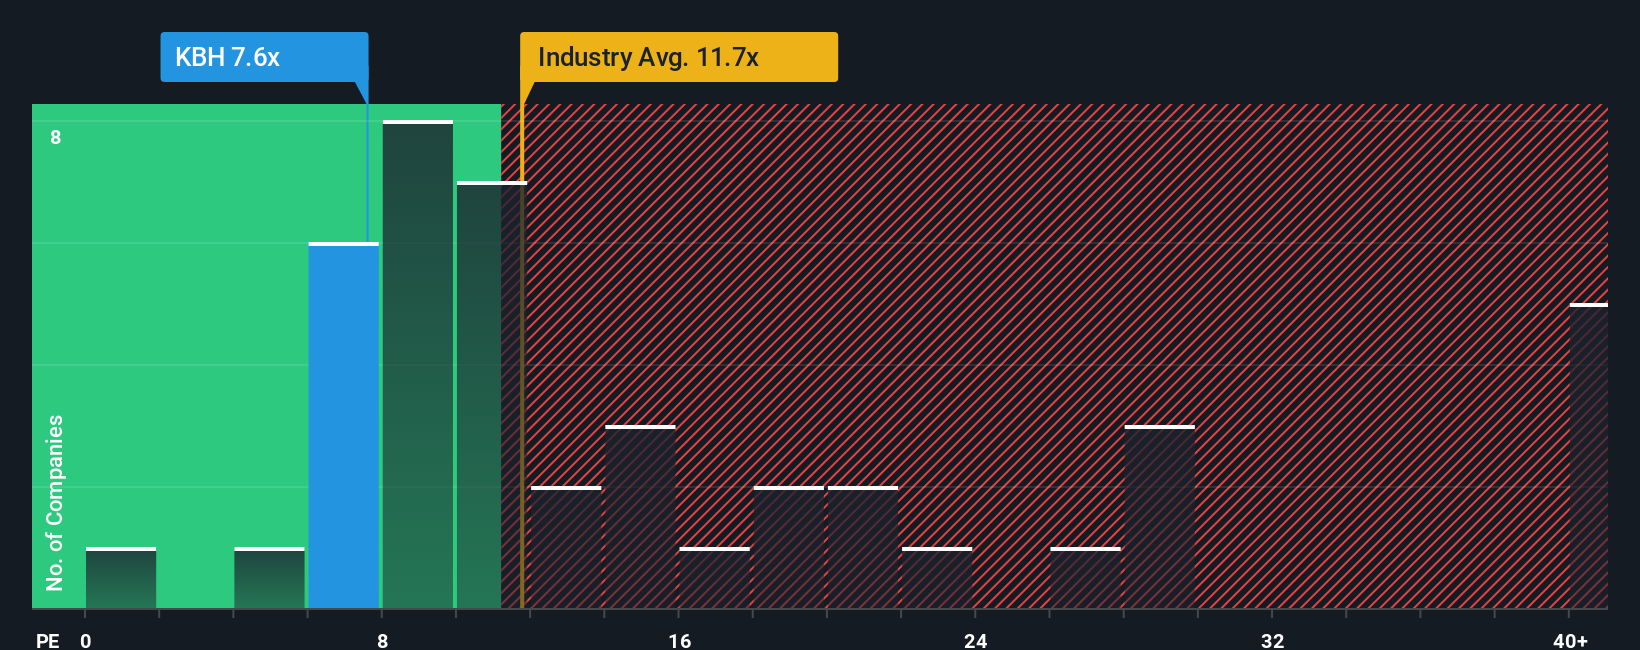
For a profitable company like KB Home, the P/E ratio is a useful way to think about value because it ties the share price directly to the earnings that shareholders currently receive.
In general, higher growth expectations and lower perceived risk can justify a higher P/E ratio. Slower expected growth or higher risk tends to support a lower, more conservative P/E as a “normal” range.
KB Home currently trades on a P/E of 9.03x. That sits below the Consumer Durables industry average P/E of 13.57x and also below the peer average of 15.84x, so the market is paying fewer dollars for each dollar of KB Home’s earnings than for many peers.
Simply Wall St’s Fair Ratio for KB Home is 11.07x. This is a proprietary estimate of what a “reasonable” P/E could be for the company, based on factors such as its earnings growth profile, profit margins, risk characteristics, industry group and market cap.
Compared with a simple industry or peer comparison, the Fair Ratio aims to be more tailored, since it incorporates company specific features rather than treating all homebuilders as identical.
With the Fair Ratio of 11.07x above the current P/E of 9.03x, KB Home screens as undervalued on this earnings based approach.
Result: UNDERVALUED
P/E ratios tell one story, but what if the real opportunity lies elsewhere? Start investing in legacies, not executives. Discover our 22 top founder-led companies.
Earlier we mentioned that there is an even better way to understand valuation, so let us introduce you to Narratives. These are simply your own story about a company, tied directly to your assumptions for fair value and for its future revenue, earnings and margins.
On Simply Wall St’s Community page, used by millions of investors, a Narrative lets you spell out how you think KB Home’s business might progress. You can then turn that into a forecast and then into a fair value that you can compare with today’s share price to decide whether it looks attractive or not.
Narratives update automatically when new information such as news or earnings is added to the platform. This means your view stays current without you needing to rebuild the whole model each time.
For example, one KB Home Narrative might assume a relatively cautious revenue path and lower profit margins that point to a fair value well below the current price. Another might assume stronger revenue and healthier margins that support a fair value closer to or above where the shares trade today.
Do you think there's more to the story for KB Home? Head over to our Community to see what others are saying!
This article by Simply Wall St is general in nature. We provide commentary based on historical data and analyst forecasts only using an unbiased methodology and our articles are not intended to be financial advice. It does not constitute a recommendation to buy or sell any stock, and does not take account of your objectives, or your financial situation. We aim to bring you long-term focused analysis driven by fundamental data. Note that our analysis may not factor in the latest price-sensitive company announcements or qualitative material. Simply Wall St has no position in any stocks mentioned.
