
Please use a PC Browser to access Register-Tadawul
Get It
Is It Time To Reassess Smithfield Foods (SFD) After Mixed Recent Share Price Moves?
Smithfield Foods, Inc. SFD | 25.04 | +0.97% |
A Discounted Cash Flow model uses estimates of the cash a company could generate in the future and discounts those values back to today. It aims to translate long term cash generation into a single present value per share.
For Smithfield Foods, the model used here is a 2 Stage Free Cash Flow to Equity approach, based on cash flow projections in $. The latest twelve month free cash flow is about $407.3 million. Analysts provide explicit forecasts out to 2027, with free cash flow for that year of $735 million, and Simply Wall St then extrapolates further, with projected free cash flow of $1,503.2 million in 2035.
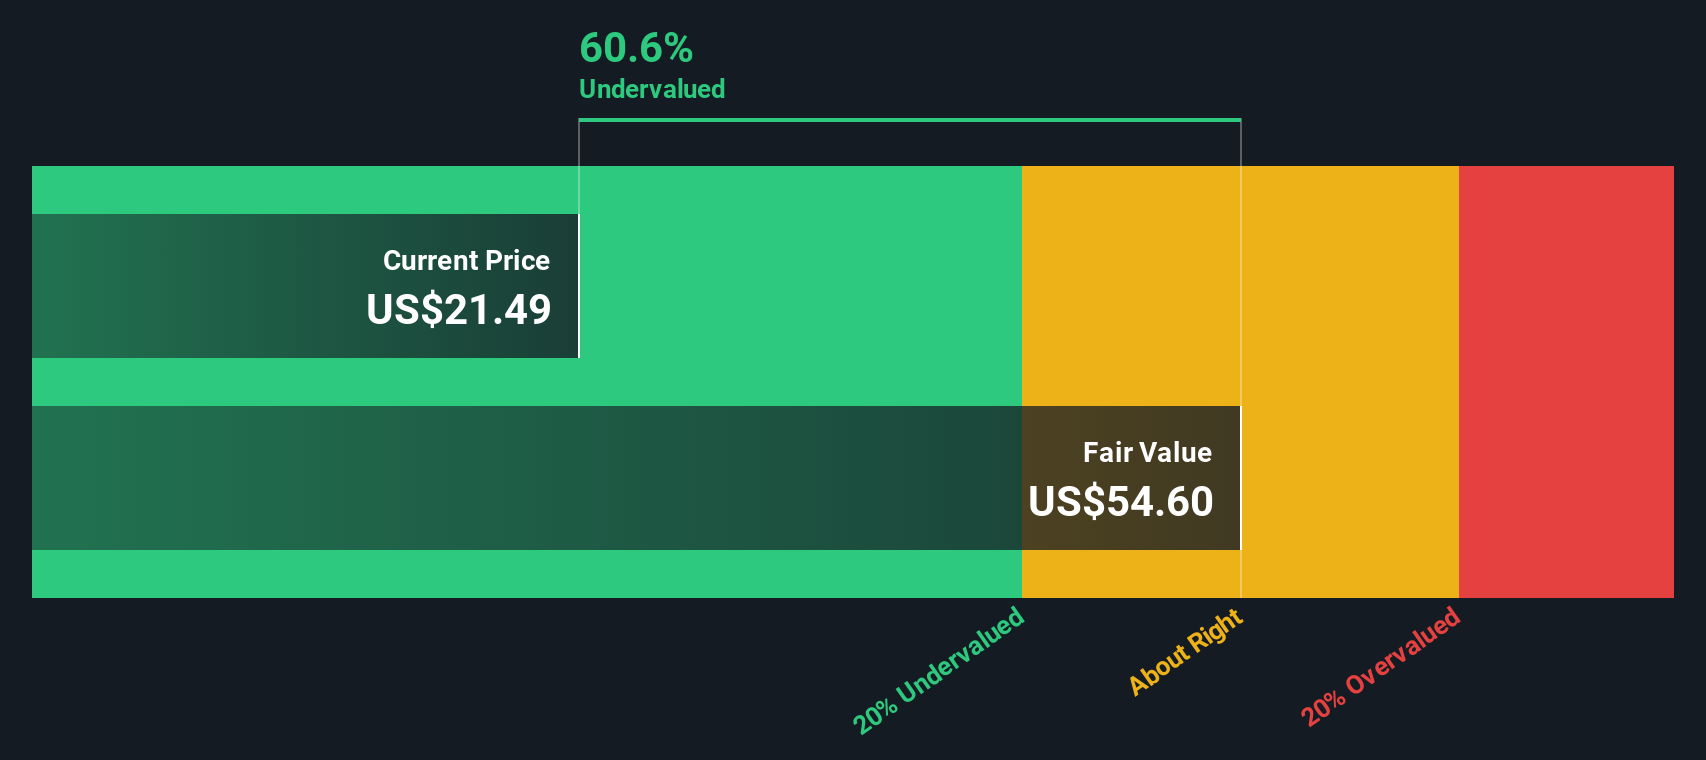
Adding up the discounted value of these projected cash flows and the terminal value produces an estimated intrinsic value of US$73.26 per share, compared with the recent share price of US$23.10. On this DCF view, the stock appears around 68.5% undervalued.
Result: UNDERVALUED
Our Discounted Cash Flow (DCF) analysis suggests Smithfield Foods is undervalued by 68.5%. Track this in your watchlist or portfolio, or discover 880 more undervalued stocks based on cash flows.
P/E is a useful cross check for profitable companies because it ties the share price directly to current earnings, which is what you ultimately rely on as a shareholder. A higher or lower P/E often reflects what the market is expecting around future earnings growth and how much risk investors feel they are taking on.
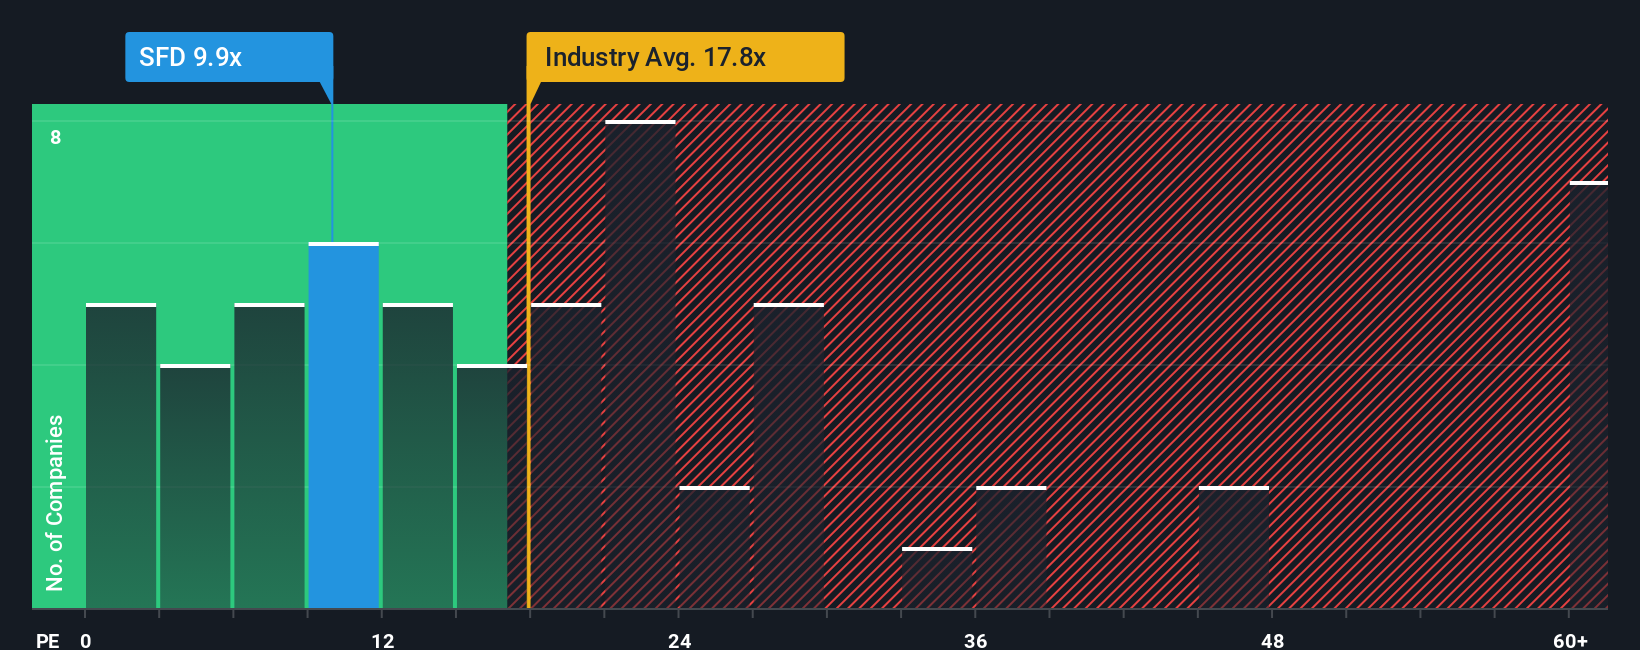
Smithfield Foods is trading on a P/E of 10.45x. That sits below both the Food industry average of 21.31x and the peer group average of 16.35x, which suggests the market is applying a lower earnings multiple to Smithfield Foods than to many of its listed food peers.
Simply Wall St also uses a proprietary “Fair Ratio” for P/E, which is the P/E level it would expect for Smithfield Foods after considering factors like earnings growth profile, profit margins, industry, company size and identified risks. This Fair Ratio is designed to be more tailored than a simple comparison with industry or peer averages, because it adjusts for the company’s specific characteristics rather than treating all food companies as alike. On this framework, Smithfield Foods’ current P/E of 10.45x sits below its Fair Ratio, so the shares screen as undervalued using the preferred multiple.
Result: UNDERVALUED
P/E ratios tell one story, but what if the real opportunity lies elsewhere? Discover 1427 companies where insiders are betting big on explosive growth.
Earlier we mentioned that there is an even better way to understand valuation, so let us introduce you to Narratives. These are simply your story about Smithfield Foods linked directly to the numbers you care about, like your assumed fair value and your expectations for future revenue, earnings and margins.
On Simply Wall St, Narratives live in the Community page and give you a straightforward way to connect a company’s story to a financial forecast and then to a fair value that you can compare with the current share price to help decide whether you want to buy, hold or sell.
Because Narratives on the platform are updated automatically when new information comes in, such as earnings releases or major news, your fair value view can stay aligned with the latest data without you needing to rebuild your whole model each time.
For example, one Smithfield Foods Narrative might assume a higher fair value based on stronger long term margins, while another might point to a lower fair value if the author is more cautious about revenue growth and profitability.
Do you think there's more to the story for Smithfield Foods? Head over to our Community to see what others are saying!

This article by Simply Wall St is general in nature. We provide commentary based on historical data and analyst forecasts only using an unbiased methodology and our articles are not intended to be financial advice. It does not constitute a recommendation to buy or sell any stock, and does not take account of your objectives, or your financial situation. We aim to bring you long-term focused analysis driven by fundamental data. Note that our analysis may not factor in the latest price-sensitive company announcements or qualitative material. Simply Wall St has no position in any stocks mentioned.
