Is It Time To Reassess TPG (TPG) After Recent Share Price Pullback?
TPG Inc Class A TPG | 0.00 |
- If you are wondering whether TPG is attractively priced or just riding past momentum, this article walks through what the current share price really implies about value.
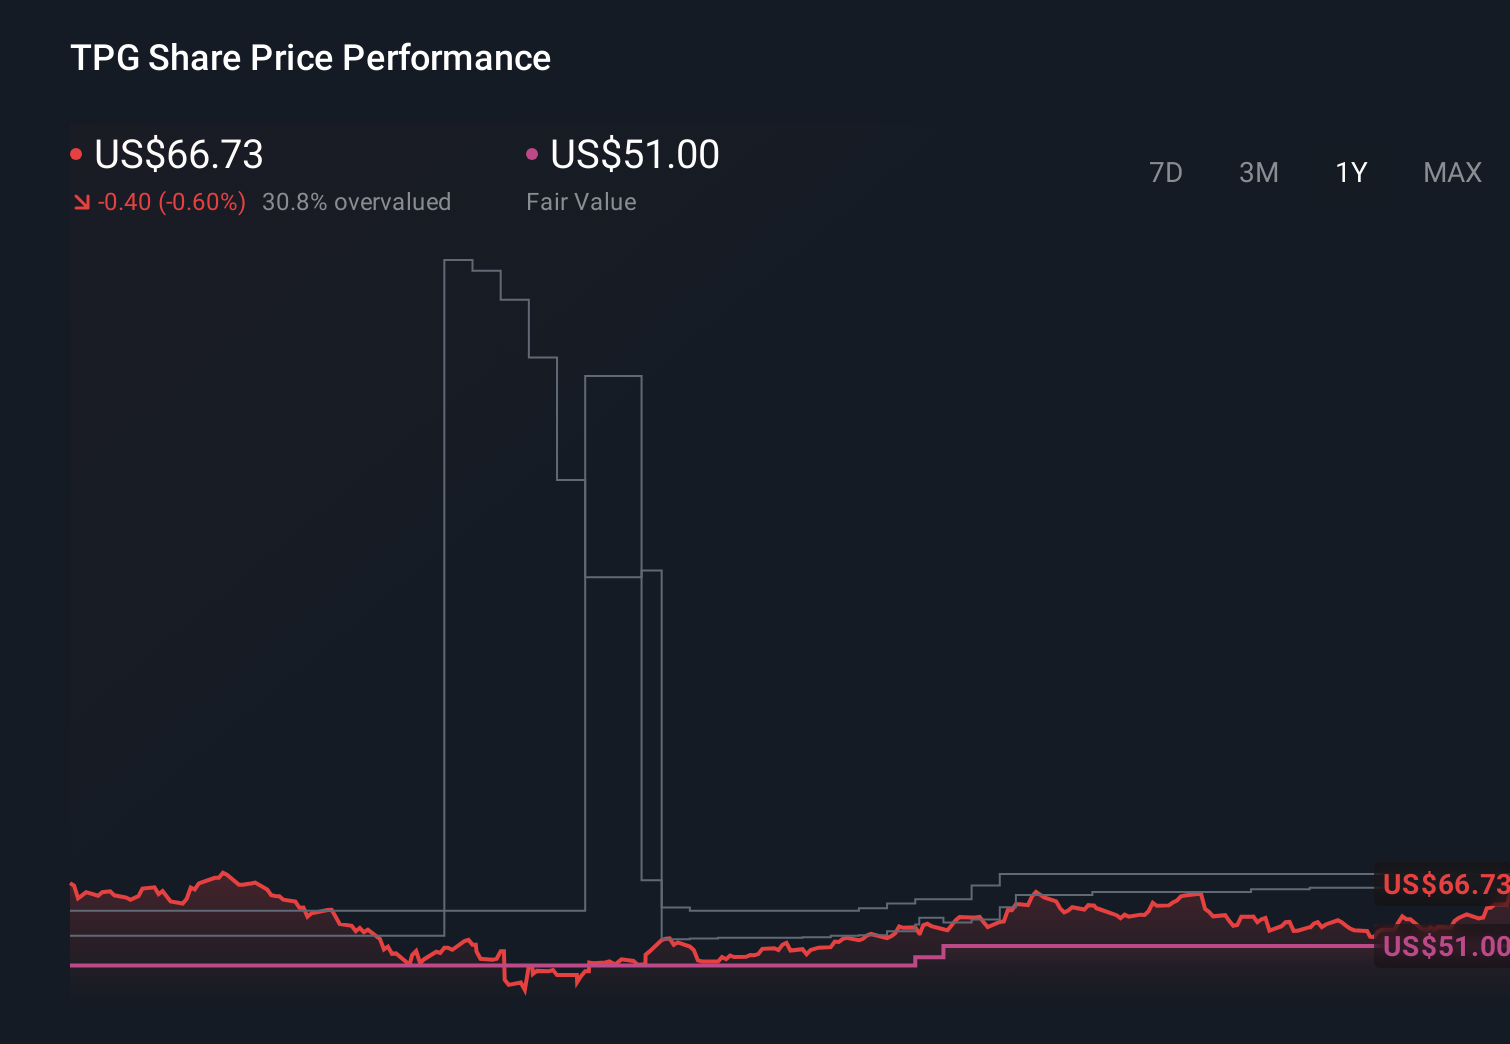
- TPG shares recently closed at US$58.86, with returns of a 6.6% decline over 7 days, an 8.5% decline over 30 days, a 10.5% decline year to date, and a 94.4% gain over 3 years.
- Recent attention around TPG has focused on its role in diversified financials and how investors are reassessing risk and reward for the sector. That shift in sentiment helps frame why the share price has pulled back in the short term while still sitting well above levels from three years ago.
- On Simply Wall St's valuation checks, TPG currently scores 1 out of 6. In this article, we look at how different methods assess the stock and then finish with a way to make sense of these valuation signals in a more complete, portfolio-friendly way.
TPG scores just 1/6 on our valuation checks. See what other red flags we found in the full valuation breakdown.
Approach 1: TPG Excess Returns Analysis
The Excess Returns model looks at how much value a company can create over and above the return that shareholders require, based on its equity, earnings power and cost of capital.
For TPG, the model starts with a Book Value of $7.48 per share and a Stable EPS estimate of $2.77 per share, sourced from weighted future Return on Equity estimates from 4 analysts. That implies an Average Return on Equity of 36.75%, which is compared with a Cost of Equity of $0.63 per share. The difference, an Excess Return of $2.15 per share, is what this approach treats as value created beyond the shareholder return requirement.
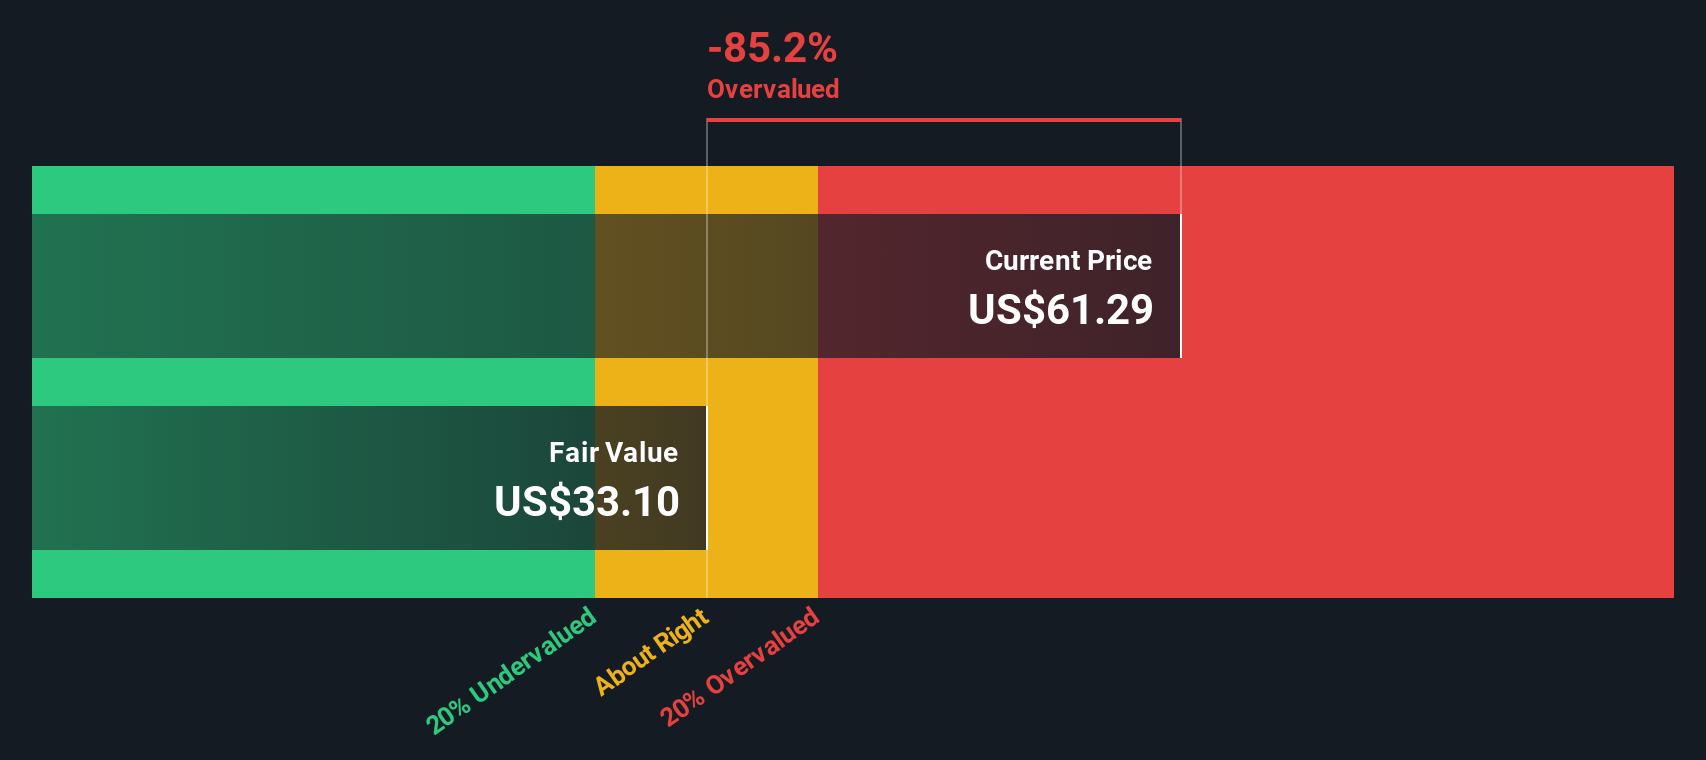
The Stable Book Value used in the model is $7.55 per share, based on future Book Value estimates from 2 analysts. Combining these inputs, the Excess Returns framework produces an intrinsic value estimate of about $50.22 per share.
Compared with the recent share price of US$58.86, this implies the stock is about 17.2% overvalued on this model. In other words, the market price is running ahead of the Excess Returns valuation.
Result: OVERVALUED
Our Excess Returns analysis suggests TPG may be overvalued by 17.2%. Discover 866 undervalued stocks or create your own screener to find better value opportunities.
Approach 2: TPG Price vs Earnings
For a profitable company like TPG, the P/E ratio is a useful way to gauge what investors are currently willing to pay for each dollar of earnings. It captures both what the business is earning today and what the market expects those earnings to look like over time. Higher expected growth and lower perceived risk tend to support a higher, or richer, P/E, while slower growth or higher risk usually justify a lower, or more cautious, P/E.
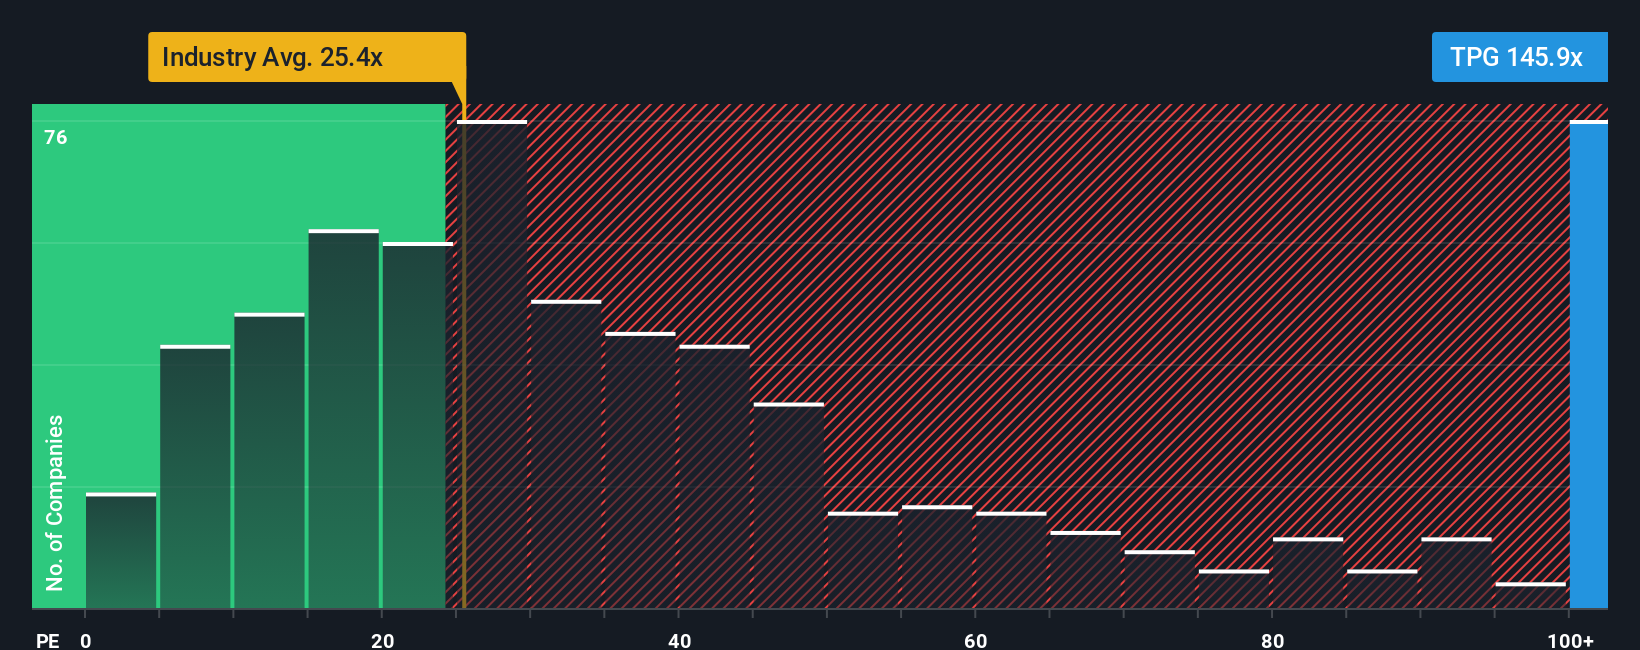
TPG is currently trading on a P/E of 146.48x. That sits well above the Capital Markets industry average of 23.92x and also above the peer average of 59.89x that Simply Wall St uses for comparison. To move beyond simple peer and industry checks, Simply Wall St uses a proprietary “Fair Ratio” that estimates what a more tailored P/E might look like after accounting for factors such as earnings growth, risk profile, profit margins, industry group and market capitalization.
For TPG, this Fair Ratio is 27.63x, which is significantly below the current 146.48x. On this preferred multiple basis, the shares look expensive relative to what the Fair Ratio suggests.
Result: OVERVALUED
P/E ratios tell one story, but what if the real opportunity lies elsewhere? Discover 1414 companies where insiders are betting big on explosive growth.
Upgrade Your Decision Making: Choose your TPG Narrative
Earlier we mentioned that there is an even better way to understand valuation, so let us introduce you to Narratives, a simple way to connect your view of TPG’s story with the numbers behind it.
A Narrative is your own clear story about a company that sits behind the data, including what you think a fair value might be and how you see future revenue, earnings and profit margins playing out over time.
On Simply Wall St’s Community page, used by millions of investors, Narratives turn that story into a financial forecast that links through to a fair value. It then compares that fair value to today’s share price to help you consider whether you see TPG as closer to a buy, a hold, or a sell for your situation.
Because Narratives update as new information such as news or earnings is released, one TPG investor might build a Narrative that supports a higher fair value. Another, using more cautious assumptions, might arrive at a much lower figure even though they are looking at the same company.
Do you think there's more to the story for TPG? Head over to our Community to see what others are saying!
This article by Simply Wall St is general in nature. We provide commentary based on historical data and analyst forecasts only using an unbiased methodology and our articles are not intended to be financial advice. It does not constitute a recommendation to buy or sell any stock, and does not take account of your objectives, or your financial situation. We aim to bring you long-term focused analysis driven by fundamental data. Note that our analysis may not factor in the latest price-sensitive company announcements or qualitative material. Simply Wall St has no position in any stocks mentioned.