Is It Time To Reassess Twilio (TWLO) After Its Volatile Multi Year Share Performance
Twilio, Inc. Class A TWLO | 130.95 | +0.38% |
- If you are wondering whether Twilio's current share price really lines up with its fundamentals, this article is going to focus squarely on what you are getting for the price you pay.
- Twilio's share price recently closed at US$129.83, with returns of 19.4% over 1 year, a 134.9% return over 3 years and a 66.0% decline over 5 years. This suggests the market has shifted its view of the stock more than once.
- Recent attention on Twilio has centered on its position as a communications platform provider and how investors interpret its role in software and cloud-based services, which helps frame these share price moves. Commentary has focused on how the company fits into broader software adoption trends and how that context may feed into expectations for its long term potential and risks.
- On Simply Wall St's 6 point valuation checklist, Twilio scores 2 out of 6, so we will look at what different valuation methods suggest about the stock. We will then finish with one approach that can help you tie all those signals together.
Twilio scores just 2/6 on our valuation checks. See what other red flags we found in the full valuation breakdown.
Approach 1: Twilio Discounted Cash Flow (DCF) Analysis
A Discounted Cash Flow, or DCF, model takes the cash Twilio is expected to generate in the future and discounts those amounts back to what they are worth in today’s dollars. It is essentially asking what you would pay now for all those future cash flows in one lump sum.
For Twilio, the model uses a 2 Stage Free Cash Flow to Equity approach, based on cash flow projections. The latest twelve month free cash flow sits at about $778.5 million. Analysts have provided estimates for several years, and Simply Wall St extends these with its own extrapolations, reaching a projected free cash flow of $1,220 million in 2030, with interim discounted values such as $946.3 million in 2026 and $786.6 million in 2030.
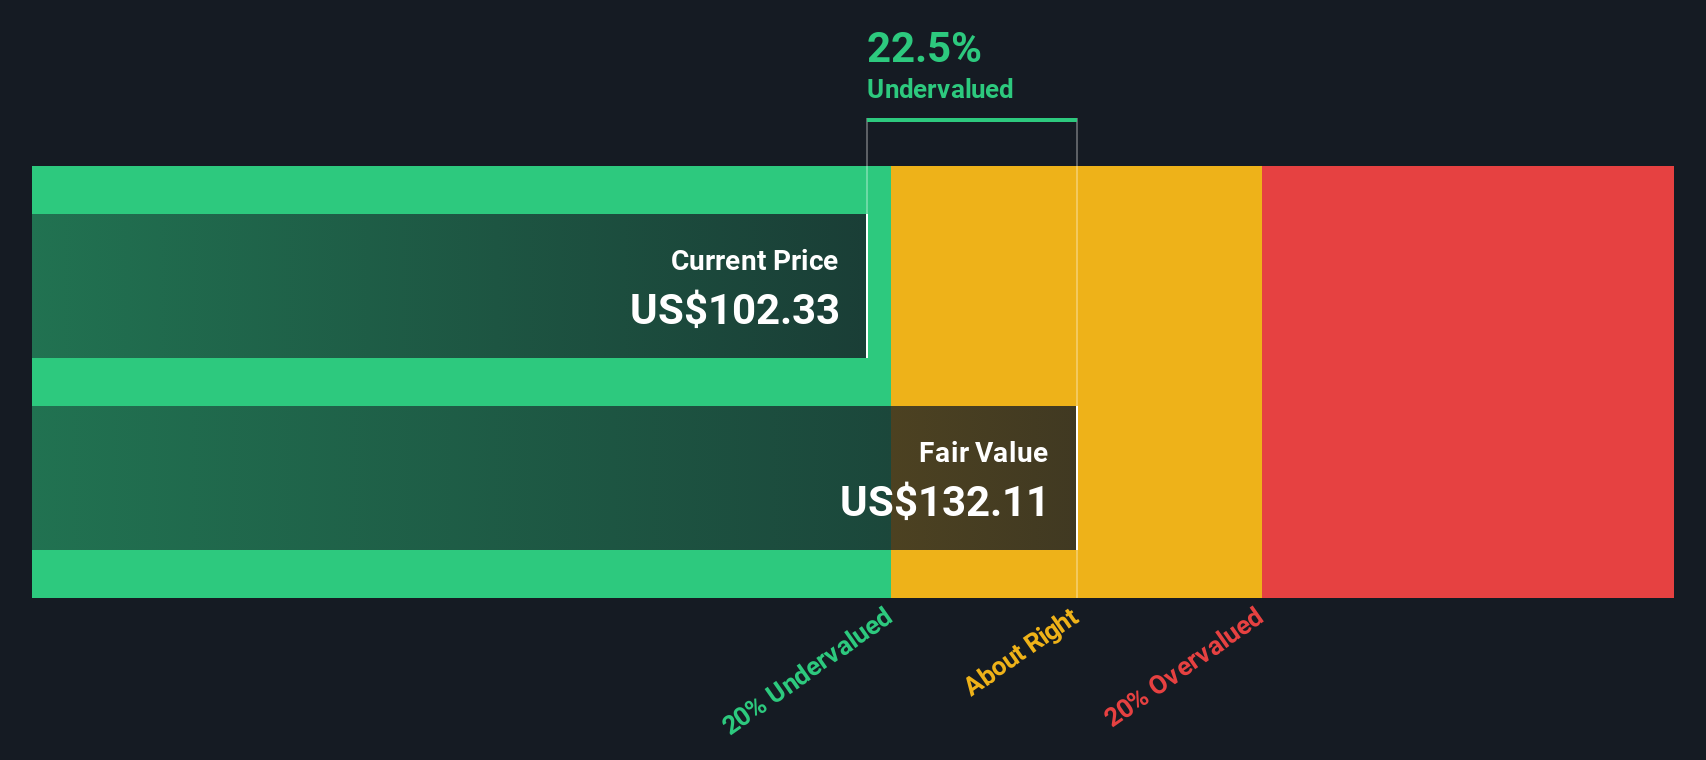
When all those projected cash flows are added up and discounted, the model arrives at an estimated intrinsic value of about $116.59 per share. Compared with the recent share price of US$129.83, the DCF output suggests the stock is roughly 11.4% overvalued on this measure.
Result: OVERVALUED
Our Discounted Cash Flow (DCF) analysis suggests Twilio may be overvalued by 11.4%. Discover 884 undervalued stocks or create your own screener to find better value opportunities.
Approach 2: Twilio Price vs Sales
For companies where profits are less of the focus, the P/S ratio is often a useful way to think about what you are paying for each dollar of revenue. It sidesteps short term earnings noise and instead asks how the market values the business relative to its top line.
What counts as a "normal" or "fair" P/S ratio usually reflects what investors expect for future growth and how much risk they see in those expectations. Higher expected growth or lower perceived risk can justify a higher multiple, while slower growth or higher risk tends to align with a lower multiple.
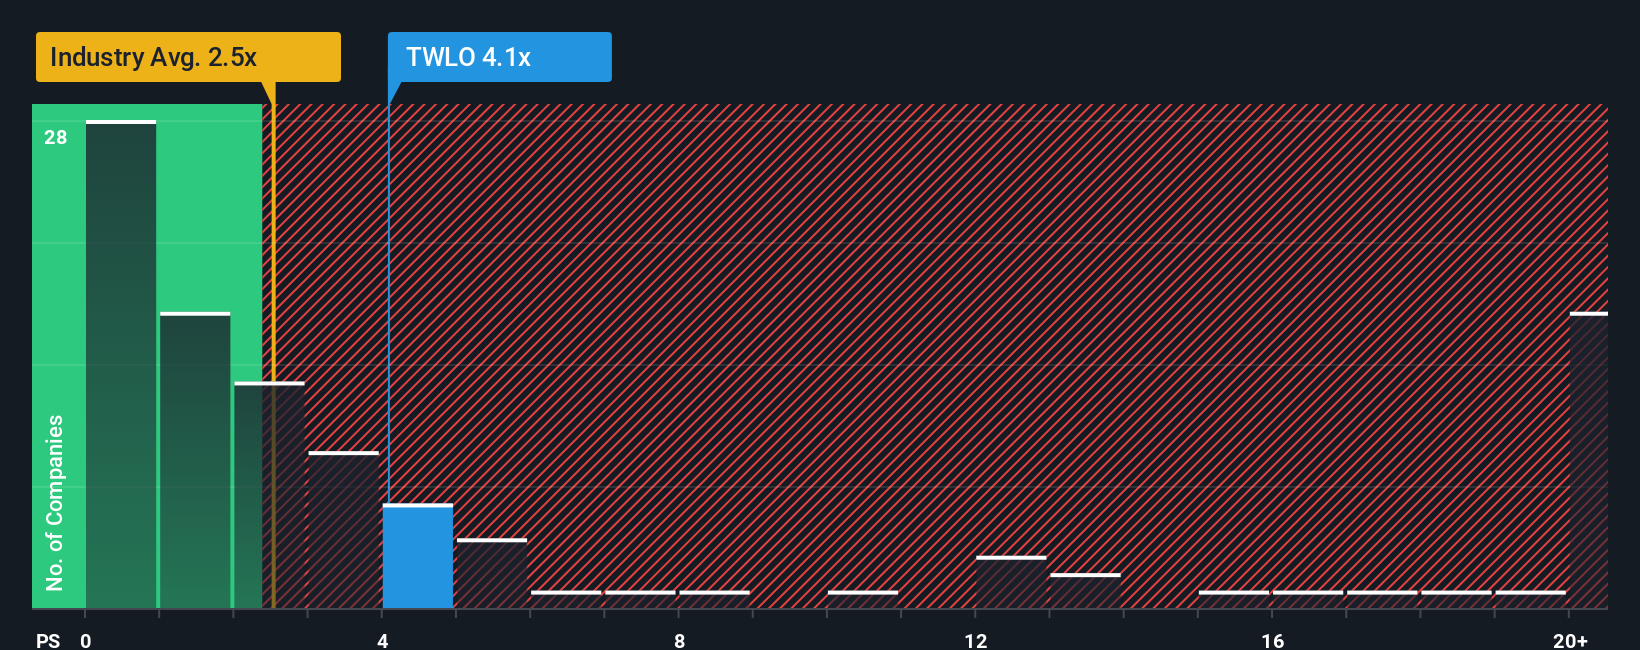
Twilio currently trades on a P/S of 4.02x. That sits above the broader IT industry average of 2.35x, but below the peer group average of 6.51x. Simply Wall St’s Fair Ratio for Twilio is 4.70x, which is its proprietary estimate of what the P/S could be given factors such as growth profile, industry, profit margins, market cap and risk.
The Fair Ratio adds more context than a simple peer or industry comparison because it blends those company specific characteristics instead of assuming all firms deserve the same multiple. With Twilio at 4.02x versus a Fair Ratio of 4.70x, the shares screen as undervalued on this metric.
Result: UNDERVALUED
P/S ratios tell one story, but what if the real opportunity lies elsewhere? Discover 1442 companies where insiders are betting big on explosive growth.
Upgrade Your Decision Making: Choose your Twilio Narrative
Earlier we mentioned that there is an even better way to understand valuation, so let us introduce you to Narratives. These are simply your story about a company, connected directly to your own numbers for future revenue, earnings, margins and fair value. All of this is brought together in an easy tool on Simply Wall St's Community page that helps you compare your Fair Value to the current price, updates automatically when fresh news or earnings arrive, and lets you see how views can differ. For example, one Twilio Narrative estimates fair value at about US$68 per share and another puts it around US$138, based on different assumptions about things like AI driven communications demand, profit margins and the P/E you think is reasonable.
For Twilio, however, we will make it really easy for you with previews of two leading Twilio Narratives:
Each one connects a different story about AI, margins and competition to a specific fair value, so you can see which set of assumptions feels closer to your own view.
Fair value: US$138.04
Implied pricing gap vs last close: about 6.0% undervalued using ((138.04 − 129.83) ÷ 138.04)
Revenue growth assumption: 7.93% a year
- Expects growing use of AI powered and omnichannel communications to support higher margin revenue, improved customer retention and a larger addressable market for Twilio.
- Builds in benefits from product development, international reach and cost discipline, with analysts assuming profit margins rise from 0.4% to 7.6% over three years and earnings reach US$449.9m by about September 2028.
- Links these earnings and margin assumptions to a 2028 P/E of around 56.8x and a consensus target price of US$130.88, with fair value estimated at about US$138.04.
Fair value: US$68.00
Implied pricing gap vs last close: about 91.0% overvalued using ((129.83 − 68.00) ÷ 68.00)
Revenue growth assumption: 24.14% a year
- Argues that Twilio does not yet line up with a classic value approach because it lacks consistent profitability, has earnings that are hard to predict and operates in a fast changing tech space.
- Highlights concerns about the strength and durability of Twilio's competitive position, given tech heavy competition and the risk that its advantages may not form a wide or lasting moat.
- Views the valuation as lacking a clear margin of safety and suggests the stock currently suits growth oriented investors more than conservative, value focused investors.
Put together, these Narratives frame a clear choice for you, using the same company data but very different assumptions about durability of profits, AI related demand and what multiple you think is reasonable for Twilio over time.
Do you think there's more to the story for Twilio? Head over to our Community to see what others are saying!

This article by Simply Wall St is general in nature. We provide commentary based on historical data and analyst forecasts only using an unbiased methodology and our articles are not intended to be financial advice. It does not constitute a recommendation to buy or sell any stock, and does not take account of your objectives, or your financial situation. We aim to bring you long-term focused analysis driven by fundamental data. Note that our analysis may not factor in the latest price-sensitive company announcements or qualitative material. Simply Wall St has no position in any stocks mentioned.