
Please use a PC Browser to access Register-Tadawul
Get It
Is It Time To Reconsider ACADIA Pharmaceuticals (ACAD) After Recent Share Price Weakness
ACADIA Pharmaceuticals Inc. ACAD | 23.99 | -1.40% |
A Discounted Cash Flow, or DCF, model takes the cash ACADIA Pharmaceuticals is expected to generate in the future and discounts those amounts back to what they are worth in today’s dollars.
For ACADIA, the latest twelve month Free Cash Flow is about $142.7 million. Analysts have provided forecasts for several years ahead, and Simply Wall St then extends those projections further. On this basis, Free Cash Flow is projected at $819.4 million in 2030, with a series of annual estimates between 2026 and 2035 feeding into the model.
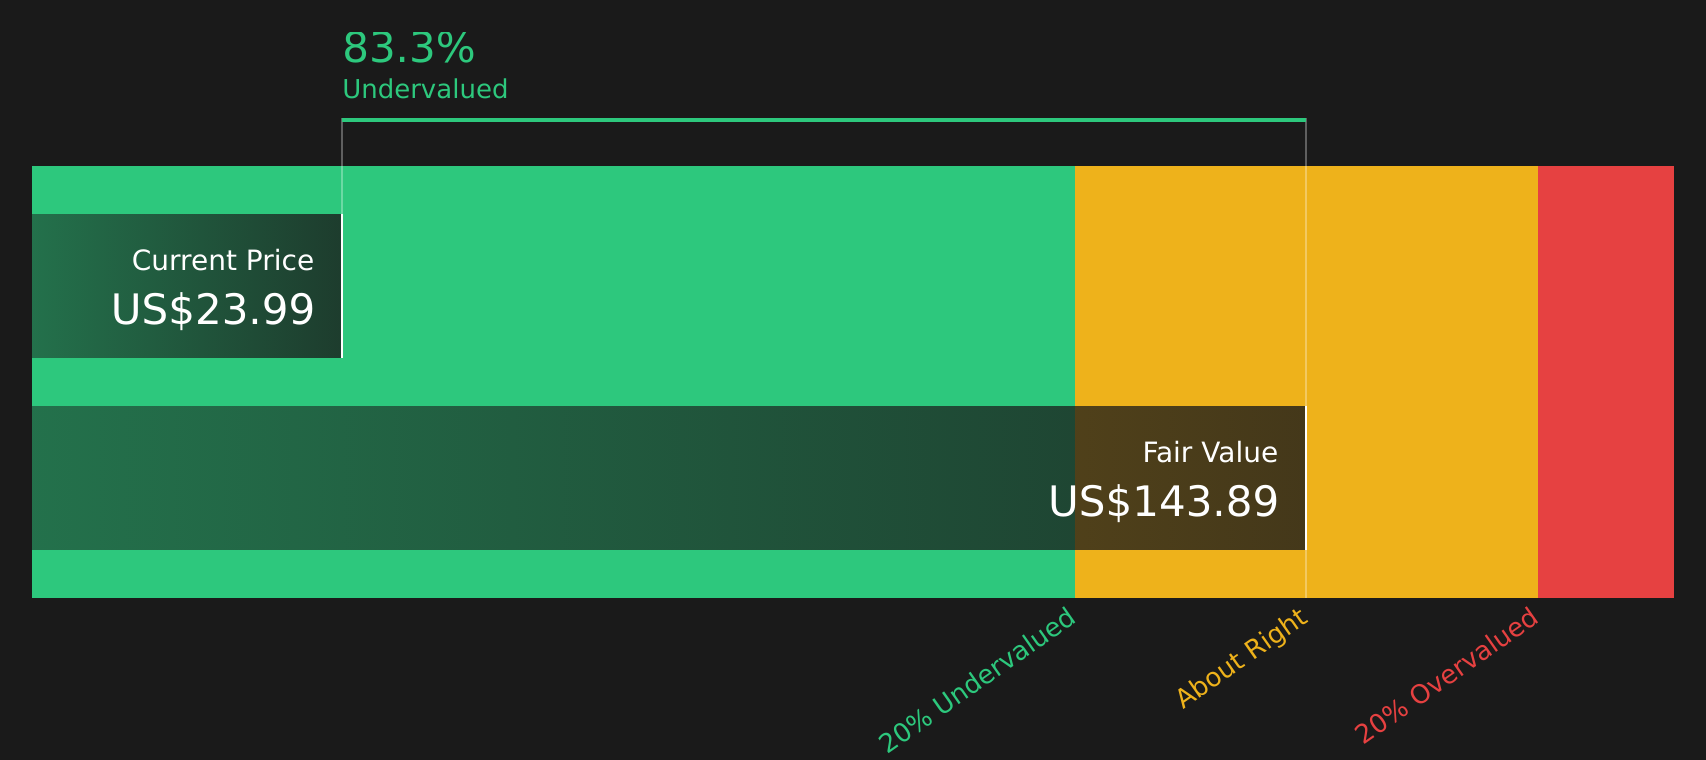
These projected cash flows, all in $, are discounted using a 2 Stage Free Cash Flow to Equity approach. The result is an estimated intrinsic value of about $88.79 per share. Compared with the recent share price of $26.46, the DCF output suggests the stock is around 70.2% undervalued under these assumptions.
This model points to a wide gap between price and cash flow based value, which is why the DCF score looks so strong here.
Result: UNDERVALUED
Our Discounted Cash Flow (DCF) analysis suggests ACADIA Pharmaceuticals is undervalued by 70.2%. Track this in your watchlist or portfolio, or discover 886 more undervalued stocks based on cash flows.
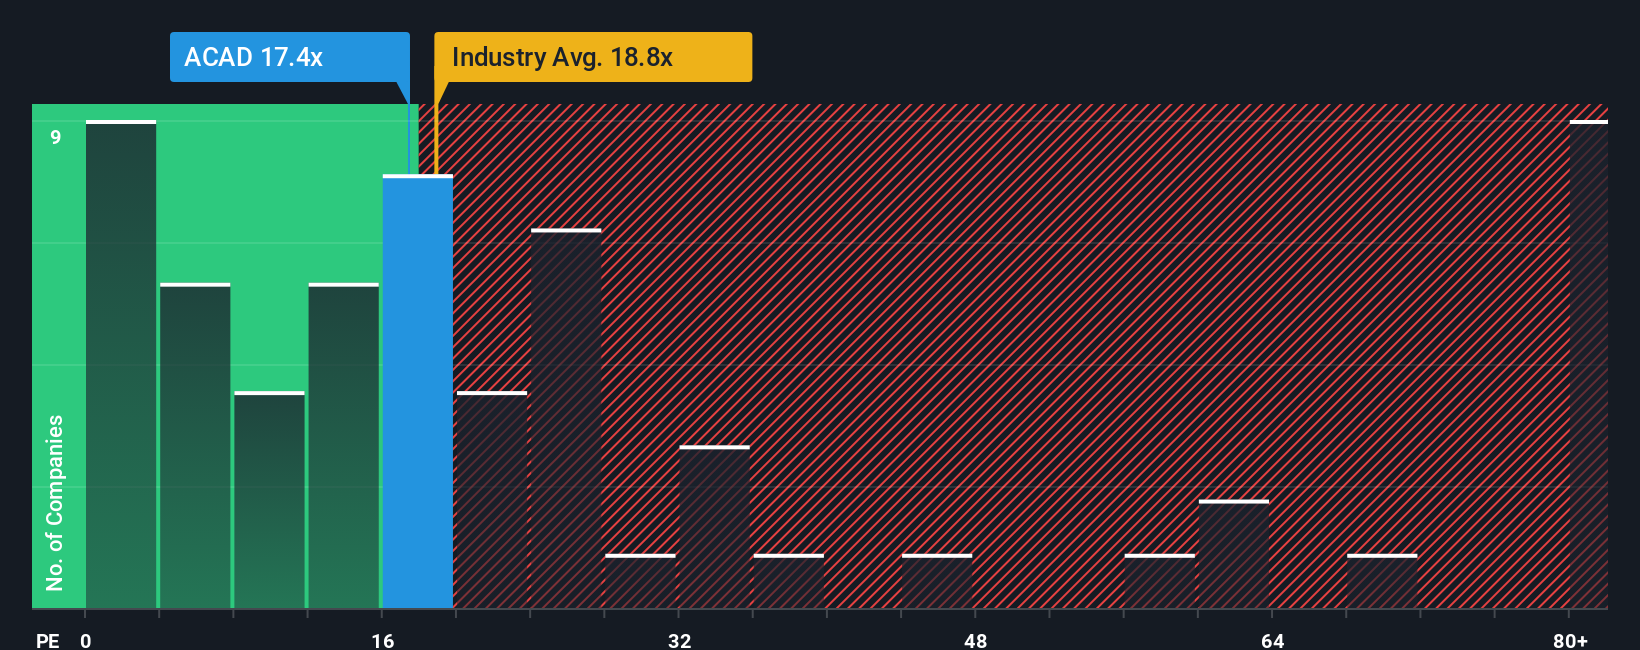
For profitable companies, the P/E ratio is a useful shorthand because it tells you how many dollars you are paying today for each dollar of current earnings. It naturally reflects what the market is willing to pay given expectations for growth and the level of risk, so a higher or lower P/E can be reasonable depending on those factors.
ACADIA Pharmaceuticals is currently trading on a P/E of 17.14x. That sits below the Biotechs industry average of 20.25x and well below the peer group average of 38.66x. On the surface, that points to a lower earnings multiple than many similar stocks in the space.
Simply Wall St also calculates a proprietary “Fair Ratio” of 21.73x for ACADIA. This is an estimate of what the P/E might be given the company’s earnings growth profile, profit margins, industry, market cap and risk characteristics. Because it is tailored to ACADIA rather than based on broad peer or industry averages, it can give a more company specific view of value. With the current P/E of 17.14x sitting below the Fair Ratio of 21.73x, this framework suggests the shares may be undervalued on an earnings basis.
Result: UNDERVALUED
P/E ratios tell one story, but what if the real opportunity lies elsewhere? Discover 1443 companies where insiders are betting big on explosive growth.
Earlier we mentioned that there is an even better way to understand valuation. Let us introduce Narratives, which let you tie your view of ACADIA Pharmaceuticals’ story to a financial forecast and a fair value, all within Simply Wall St’s Community page that millions of investors use to compare their own assumed fair value and revenue, earnings, and margin estimates with the current share price. You can update those views automatically when new news or earnings are released, and see how one investor might build a higher fair value around expectations for DAYBUE, NUPLAZID and the wider CNS pipeline, while another uses the same tools to set a lower fair value that reflects concerns about pricing controls, concentration in a single drug, or future competition. Investors can then use that gap between Fair Value and Price to help decide whether the stock appears attractive or stretched to them.
Do you think there's more to the story for ACADIA Pharmaceuticals? Head over to our Community to see what others are saying!

This article by Simply Wall St is general in nature. We provide commentary based on historical data and analyst forecasts only using an unbiased methodology and our articles are not intended to be financial advice. It does not constitute a recommendation to buy or sell any stock, and does not take account of your objectives, or your financial situation. We aim to bring you long-term focused analysis driven by fundamental data. Note that our analysis may not factor in the latest price-sensitive company announcements or qualitative material. Simply Wall St has no position in any stocks mentioned.
