Is It Time To Reconsider Rivian (RIVN) After Volkswagen Joint Venture And Recent Price Swings
Rivian Automotive, Inc. Class A RIVN | 14.69 | -3.92% |
- This article examines whether Rivian Automotive, at around US$17.73, is starting to look like value or whether the share price is still pricing in a lot of hope, by exploring what the current share price might be implying.
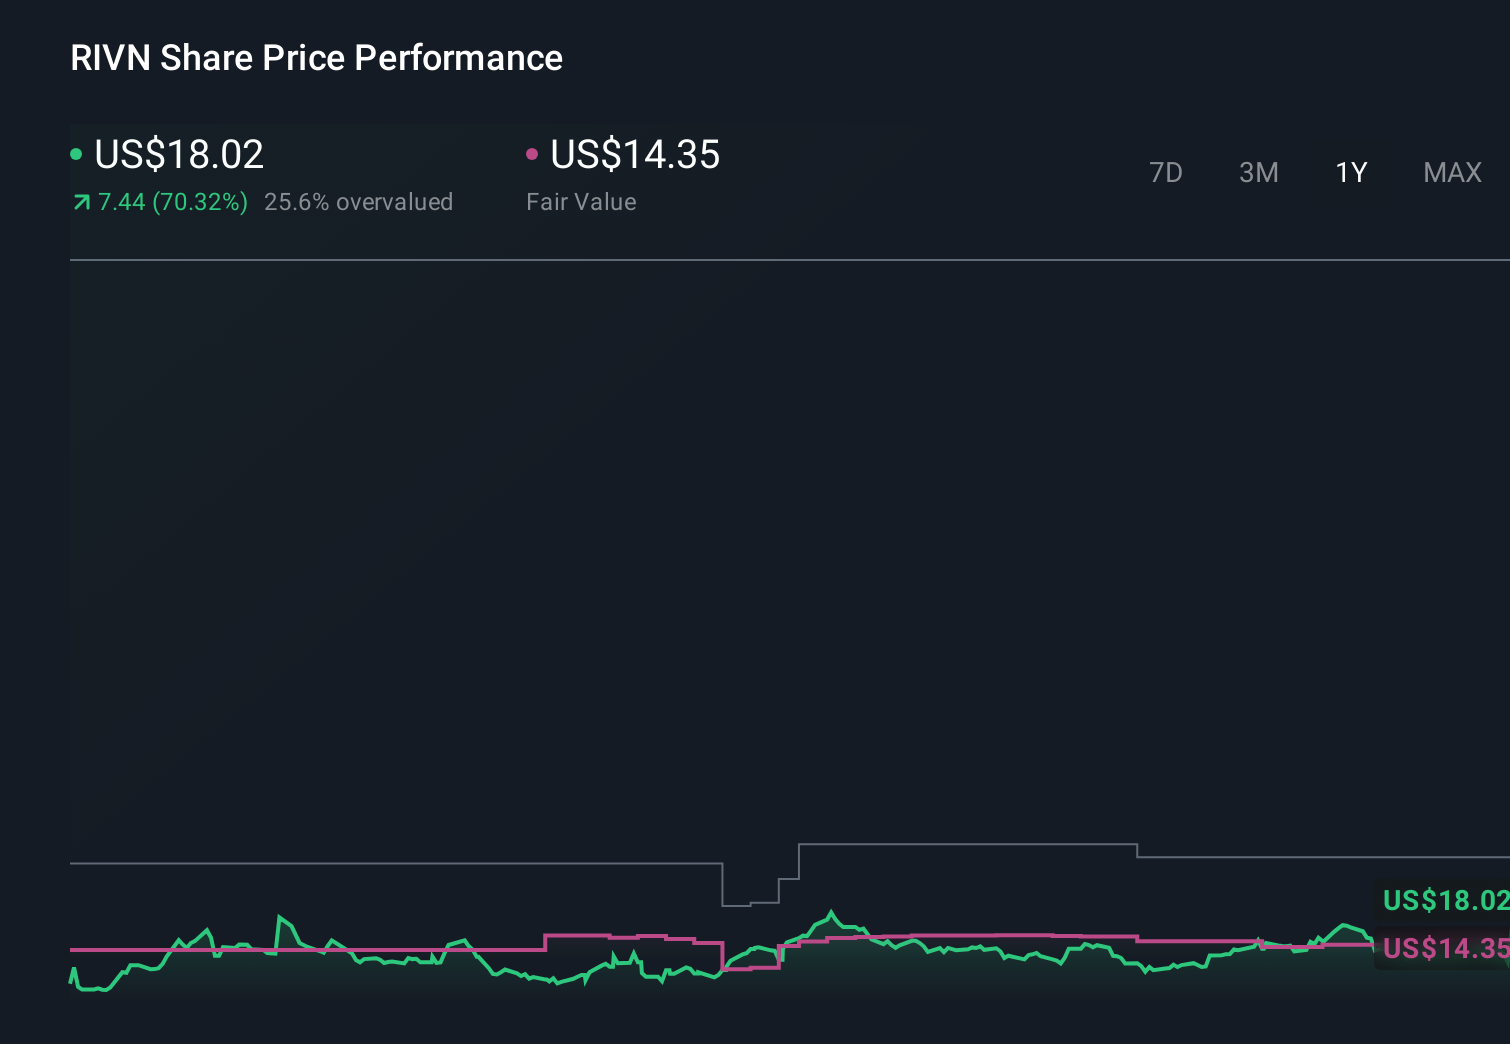
- The stock has been volatile recently, with a 19.8% return over the last 7 days, 6.4% over 30 days, a year-to-date return showing an 8.7% decline, and a 26.4% return over the past year. The 3-year return currently reflects a 12.3% decline.
- Recent attention on Rivian has centered on its position in the EV space, its production ramp-up and its ability to fund operations. Together, these factors help explain why the share price has been moving around, and they provide useful context for considering whether the current price fairly reflects the company’s prospects or leans too much on optimism or caution.
- Rivian currently scores 2 out of 6 on our valuation checks, meaning it screens as undervalued on 2 of the 6 measures we track. You can see the details in our valuation score. Next, we will walk through the main valuation approaches before finishing with a look at a more complete way to think about what the stock might be worth.
Rivian Automotive scores just 2/6 on our valuation checks. See what other red flags we found in the full valuation breakdown.
Approach 1: Rivian Automotive Discounted Cash Flow (DCF) Analysis
The Discounted Cash Flow model estimates what a company might be worth today by taking projected future cash flows and discounting them back to a present value.
For Rivian Automotive, the model used is a 2 Stage Free Cash Flow to Equity approach. The latest twelve month free cash flow is a loss of about US$2.2b. Analysts provide free cash flow estimates out to 2030, and Simply Wall St extrapolates beyond that to build a 10 year view.
Within those projections, free cash flow is forecast to shift from losses in the next few years to a positive US$2.0b in 2030, with further estimated growth after that based on the same framework. All of these future cash flows are discounted back to today and combined into a single estimate.
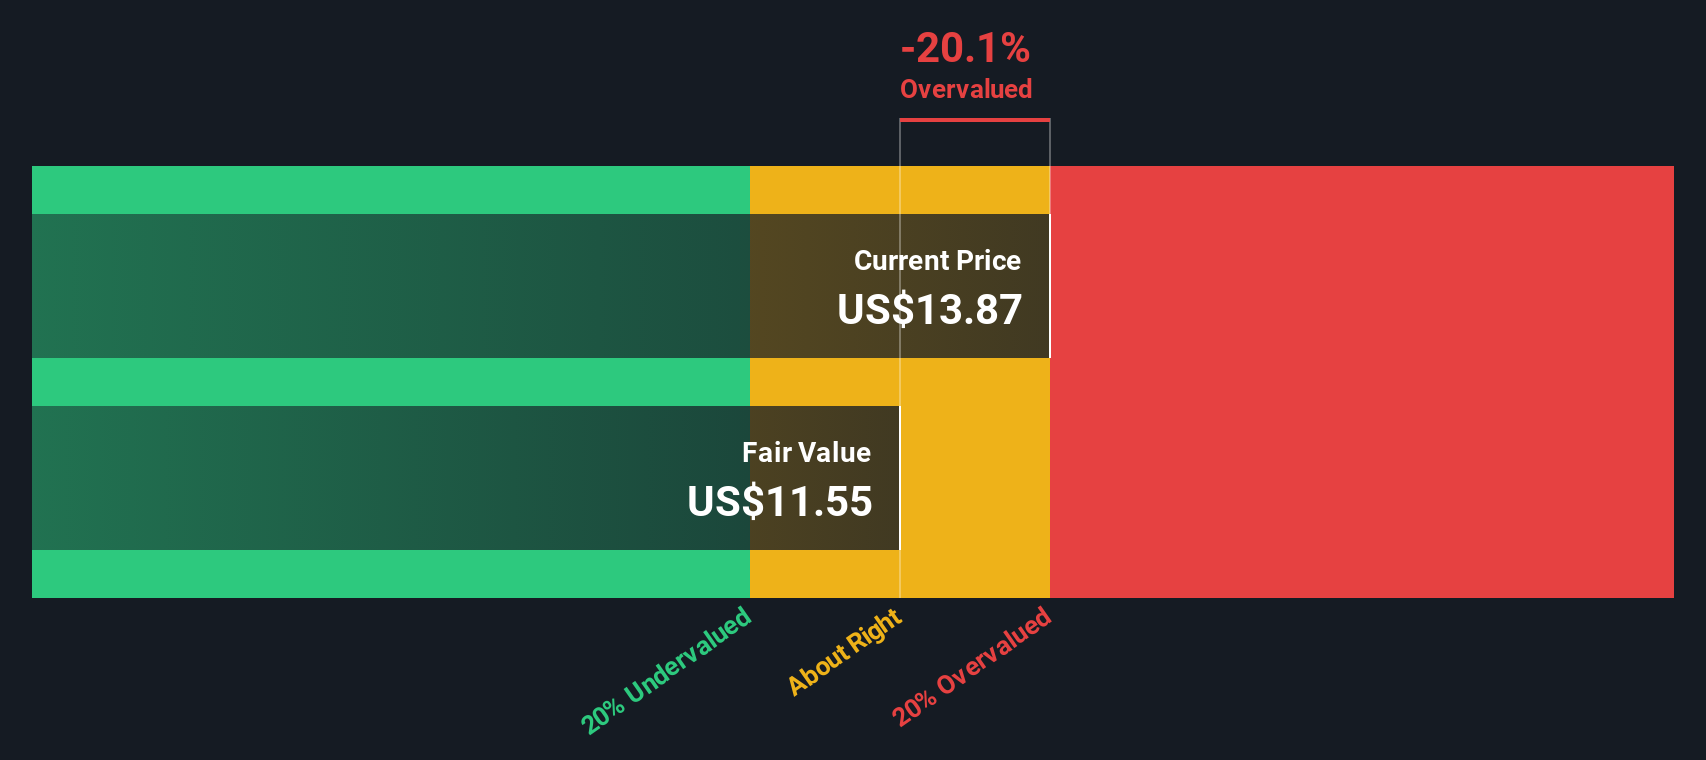
On this basis, the DCF model suggests an intrinsic value of about US$44.42 per share. This implies the current price is trading at a 60.1% discount to that estimate and indicates a stock that screens as materially undervalued on this model alone.
Result: UNDERVALUED
Our Discounted Cash Flow (DCF) analysis suggests Rivian Automotive is undervalued by 60.1%. Track this in your watchlist or portfolio, or discover 53 more high quality undervalued stocks.
Approach 2: Rivian Automotive Price vs Sales
For companies that are not yet consistently profitable, the P/S ratio is often more useful than P/E because it focuses on revenue rather than earnings, which can still be affected by heavy investment and early stage losses.
In general, higher growth expectations and lower perceived risk tend to support a higher P/S multiple. Slower growth and higher risk usually point to a lower, more conservative range. So what counts as a reasonable P/S depends on what investors think they are paying for in terms of future scale and stability.
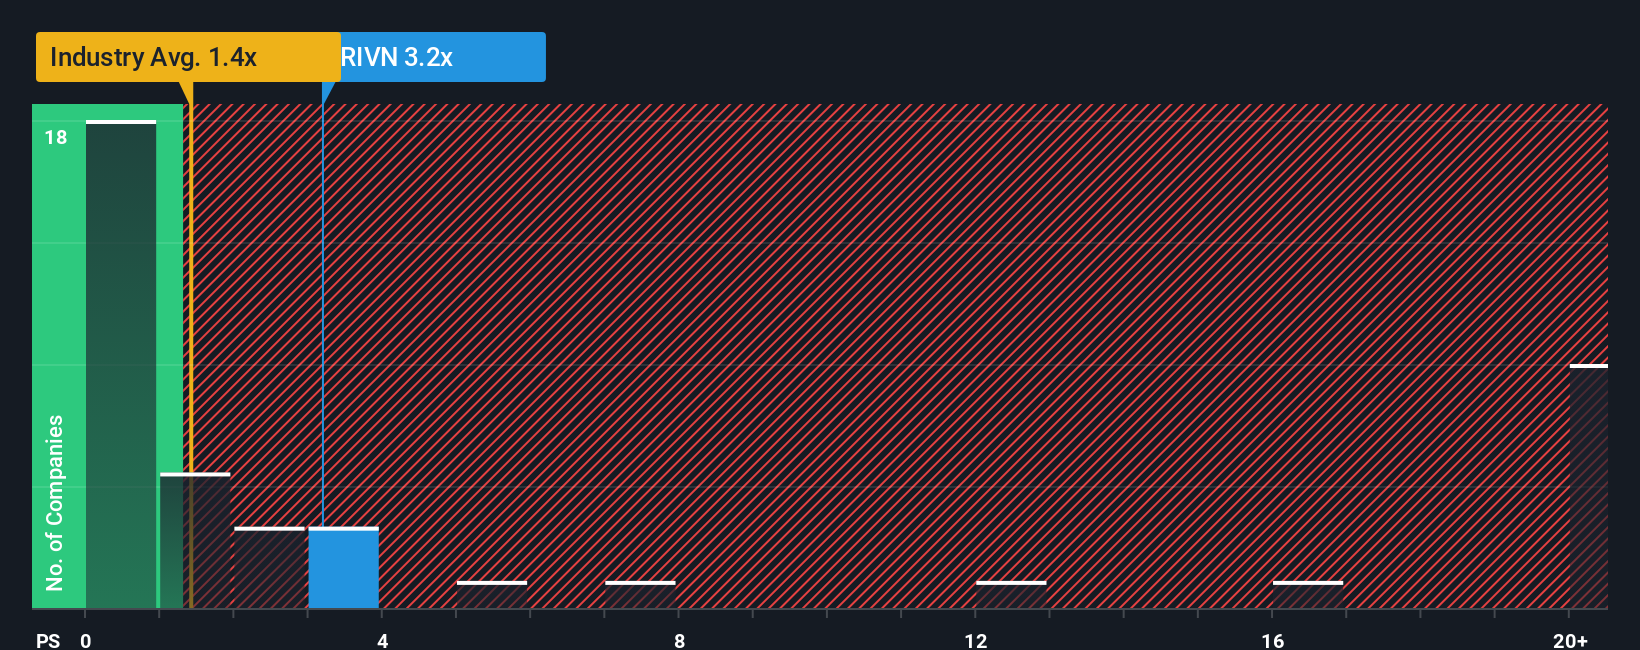
Rivian Automotive currently trades on a P/S of 4.08x. That sits above both the Auto industry average of 0.60x and the peer group average of 1.71x, which might suggest the stock carries a richer revenue multiple than many comparables. Simply Wall St also calculates a Fair Ratio of 1.29x, which is an estimate of the P/S you might expect given factors such as Rivian’s earnings profile, margins, industry, market cap and risk characteristics.
The Fair Ratio is designed to be more tailored than a simple peer or industry comparison because it adjusts for growth, risk and profitability differences rather than assuming all companies deserve similar multiples. Comparing Rivian’s current 4.08x P/S to the Fair Ratio of 1.29x points to a valuation that is higher than this model suggests.
Result: OVERVALUED
P/S ratios tell one story, but what if the real opportunity lies elsewhere? Start investing in legacies, not executives. Discover our 23 top founder-led companies.
Upgrade Your Decision Making: Choose your Rivian Automotive Narrative
Earlier we mentioned that there is an even better way to understand valuation. Let us introduce you to Narratives, which are simple stories you create about Rivian Automotive that tie your view of its products, partnerships and risks to specific forecasts for revenue, earnings and margins. These are then linked to a Fair Value you can compare with today’s share price, all within the Simply Wall St Community page that millions of investors use. Narratives update automatically when new news or earnings arrive. You can see, for example, one Rivian Narrative that assumes a Fair Value of about US$10.00 per share and another that assumes around US$19.89, giving you a clear, numbers backed way to decide whether your own view sits closer to the more cautious or more optimistic end of the spectrum.
For Rivian Automotive however we will make it really easy for you with previews of two leading Rivian Automotive Narratives:
Fair value: US$25.41 per share
Implied discount to this fair value: about 30.2% based on the last close of US$17.73
Revenue growth assumption: 48%
- Sees Gen2 R1T and R1S as a refinement of the current products, with learnings from existing owners and lower build costs feeding into future margins.
- Leans on the R2, R3 and R3X line up to broaden the customer base, while the Volkswagen joint venture and supplier scale are expected to support software, electrical architecture and cost leverage.
- Factors in additional contribution from Amazon EDV orders, broader European expansion, third party use of Rivian charging infrastructure and an eventual move toward gross profitability guidance in FY25.
Fair value: US$16.96 per share
Implied premium to this fair value: about 4.5% based on the last close of US$17.73
Revenue growth assumption: 40.76%
- Builds in strong revenue expectations tied to R2, manufacturing efficiencies and software or services, but also assumes higher future P/E multiples to justify the fair value.
- Highlights risks around policy changes, cash burn, funding needs, concentration in a relatively narrow product set and intense EV competition, which could pressure margins and delay profitability.
- Uses the current analyst consensus target of about US$13.85 as an anchor, with the view that at around US$17.73, the share price already sits slightly above this narrative fair value, so outcomes depend heavily on execution against ambitious 2028 revenue and earnings assumptions.
These two narratives frame the current debate clearly. One leans toward Rivian Automotive offering more perceived upside if its product plans and partnerships develop as anticipated. The other treats the stock as closer to fairly priced or slightly rich once execution and funding risks are fully weighed. Your task is to decide which story, if either, aligns best with your own expectations for the business, its balance sheet and your tolerance for volatility.
Do you think there's more to the story for Rivian Automotive? Head over to our Community to see what others are saying!
This article by Simply Wall St is general in nature. We provide commentary based on historical data and analyst forecasts only using an unbiased methodology and our articles are not intended to be financial advice. It does not constitute a recommendation to buy or sell any stock, and does not take account of your objectives, or your financial situation. We aim to bring you long-term focused analysis driven by fundamental data. Note that our analysis may not factor in the latest price-sensitive company announcements or qualitative material. Simply Wall St has no position in any stocks mentioned.