
Please use a PC Browser to access Register-Tadawul
Get It
Is It Too Late To Consider Carvana (CVNA) After A 65x Three Year Surge?
Carvana Co. Class A CVNA | 477.72 477.72 | +0.85% 0.00% Post |
Carvana scores just 0/6 on our valuation checks. See what other red flags we found in the full valuation breakdown.
A Discounted Cash Flow, or DCF, model projects a company’s future cash flows and then discounts those projections back to today’s dollars to estimate what the business might be worth right now.
For Carvana, the model uses a 2 Stage Free Cash Flow to Equity approach. The latest twelve month free cash flow is about $520.3 million. Analysts provide explicit forecasts out to 2030, with projected free cash flow of $4.2b in that year, and the years beyond 2030 are then extrapolated by Simply Wall St rather than based on analyst estimates.
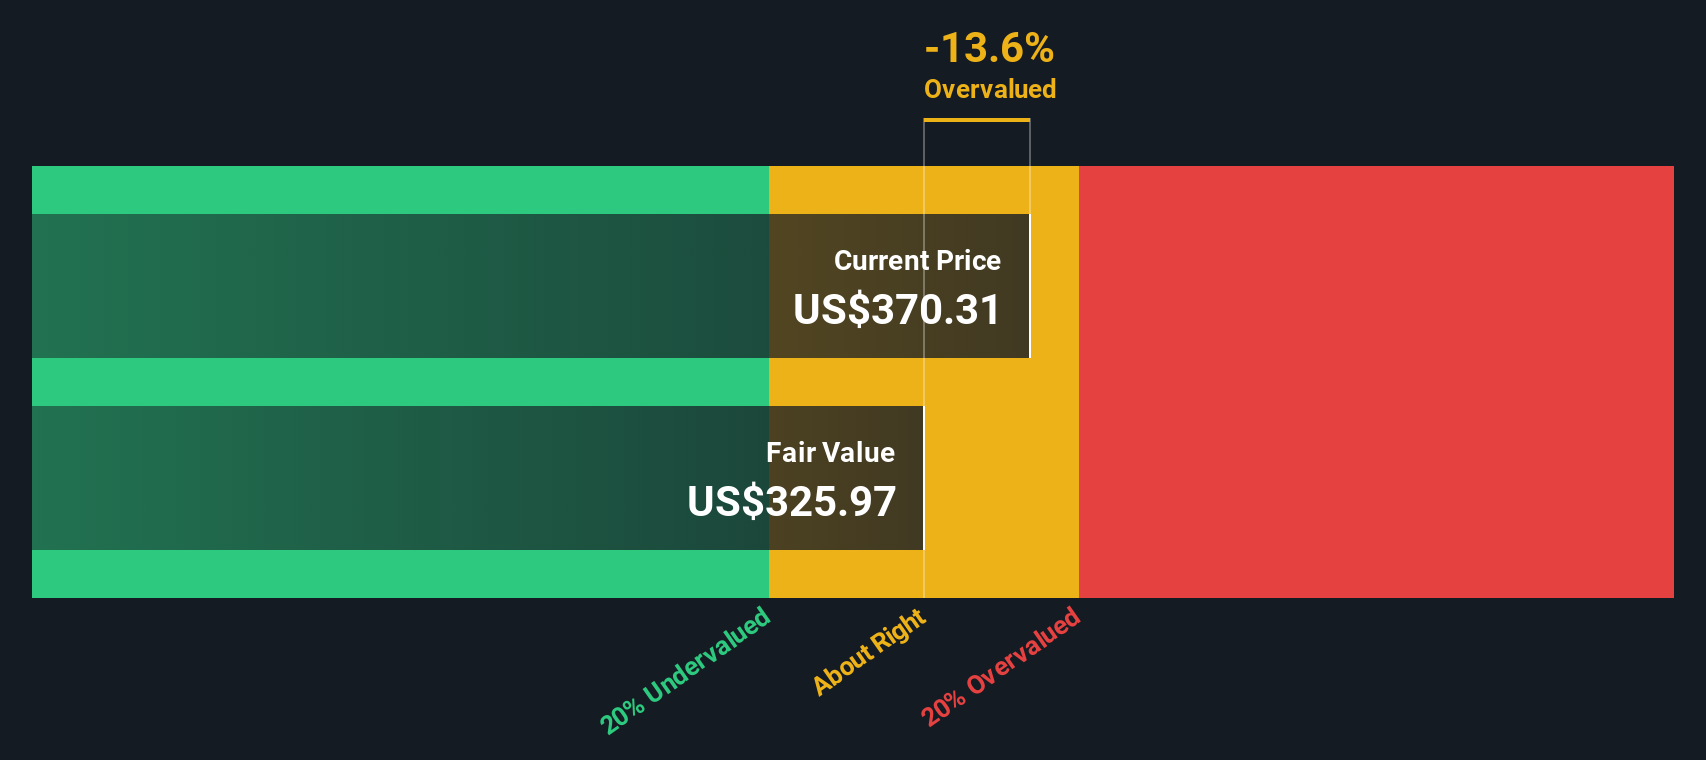
After discounting these future cash flows back to today, the DCF model arrives at an estimated intrinsic value of about $401.16 per share. Compared with the recent share price of $458.61, this indicates the stock is trading at roughly a 14.3% premium to this DCF estimate. On this metric, Carvana screens as overvalued.
Result: OVERVALUED
Our Discounted Cash Flow (DCF) analysis suggests Carvana may be overvalued by 14.3%. Discover 884 undervalued stocks or create your own screener to find better value opportunities.
For profitable companies, the P/E ratio is a common way to think about value because it links what you pay per share directly to the earnings that each share generates.
What counts as a “normal” P/E depends a lot on what investors expect from a company. Higher expected growth or lower perceived risk tends to support a higher P/E, while lower growth or higher risk usually points to a lower, more conservative multiple.
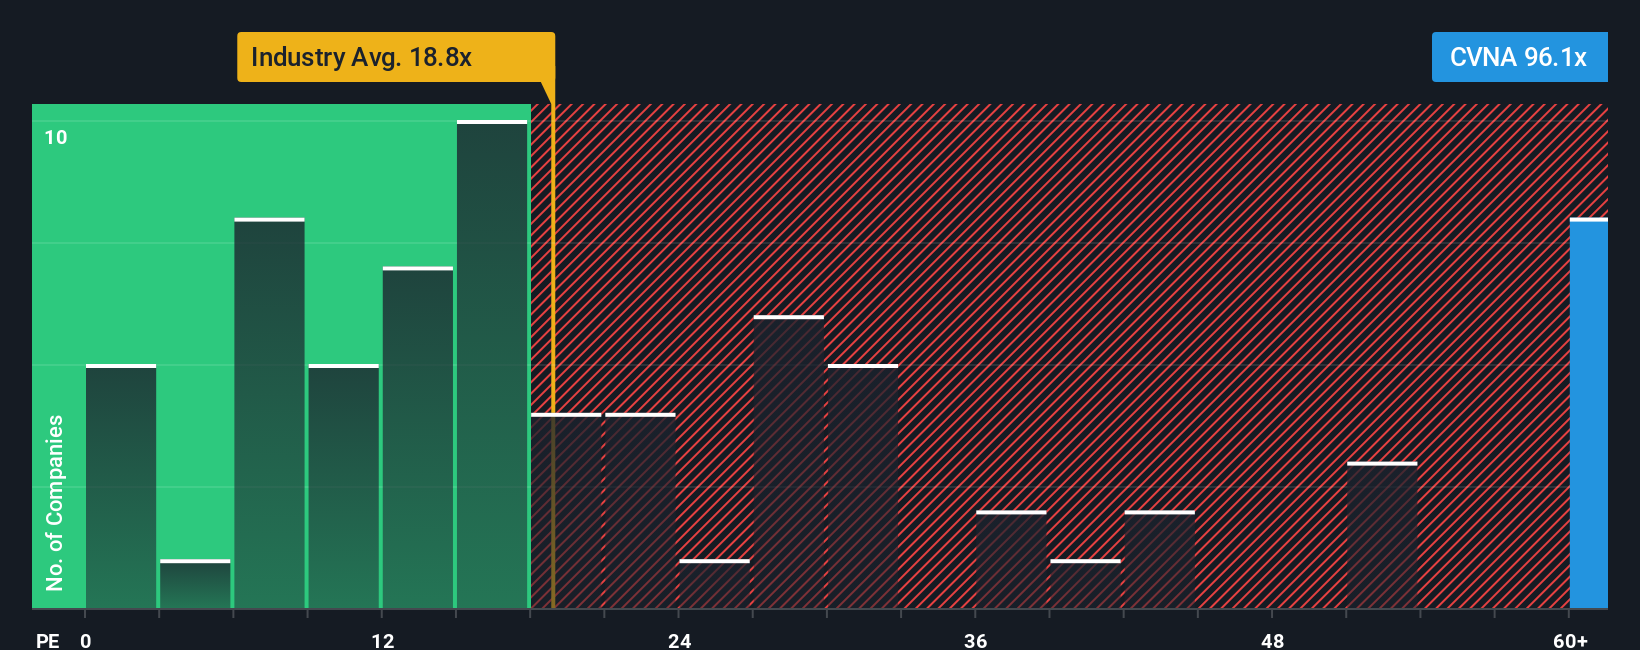
Carvana currently trades on a P/E of 103.11x. That is well above the Specialty Retail industry average P/E of 21.05x and also ahead of the peer average of 19.00x. To put this into more context, Simply Wall St calculates a proprietary “Fair Ratio” of 37.81x for Carvana, which is the P/E they would expect given factors like its earnings growth profile, industry, profit margins, market cap and key risks.
This Fair Ratio is more tailored than a simple comparison with peers or the industry because it adjusts for Carvana’s specific characteristics rather than assuming one size fits all. Against that Fair Ratio of 37.81x, the current P/E of 103.11x looks considerably higher, which points to the shares screening as expensive on this metric.
Result: OVERVALUED
P/E ratios tell one story, but what if the real opportunity lies elsewhere? Discover 1440 companies where insiders are betting big on explosive growth.
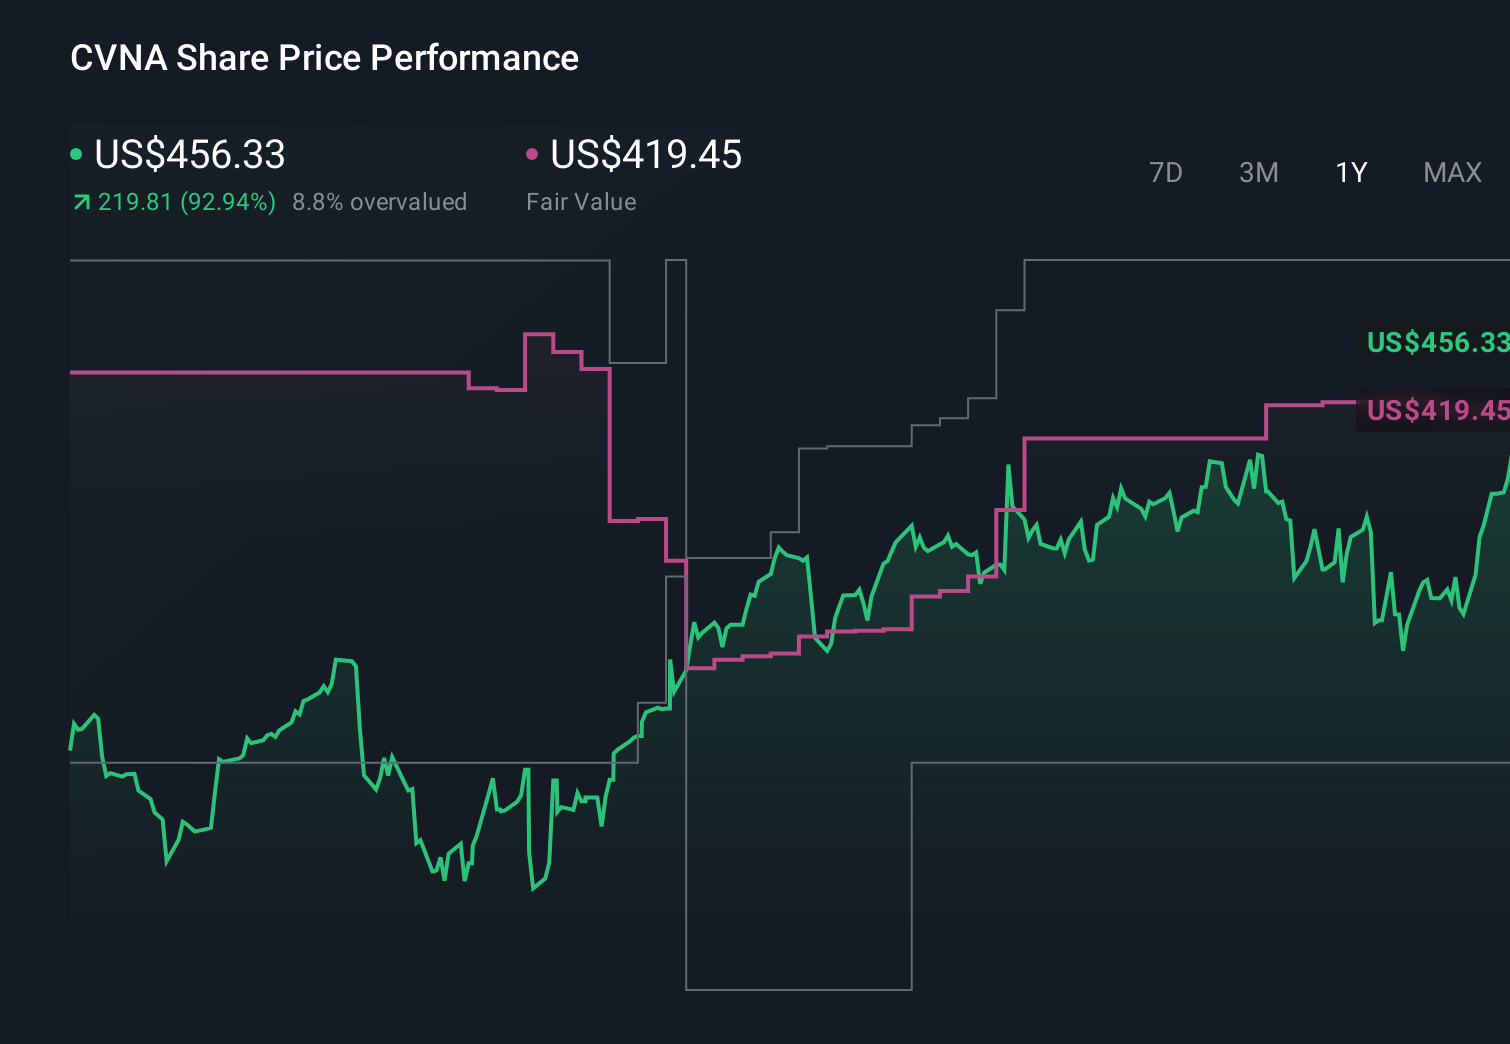
Earlier we mentioned that there is an even better way to understand valuation, so let us introduce you to Narratives, which are simply your story about a company linked directly to your own assumptions for future revenue, earnings and margins, feeding into a forecast and a fair value that you can compare with today’s price.
On Simply Wall St, Narratives live on the Community page and are designed to be easy to use. This means you can see how your view of Carvana stacks up against others, and how that translates into a Fair Value that might suggest the shares look expensive or attractive versus the current market Price.
Because Narratives update when new information such as news, earnings or analyst revisions are added, you are not locked into a static view. You can quickly see how fresh data changes both the story and the numbers supporting it.
For Carvana, one investor might focus on online buying trends, technology improvements and scaled logistics to support a higher fair value closer to US$500. Another might focus more on used vehicle pricing volatility, competitive pressures and execution risks and arrive at a lower fair value nearer to US$330. Yet both are using the same framework to connect story, forecasts and price.
Do you think there's more to the story for Carvana? Head over to our Community to see what others are saying!
This article by Simply Wall St is general in nature. We provide commentary based on historical data and analyst forecasts only using an unbiased methodology and our articles are not intended to be financial advice. It does not constitute a recommendation to buy or sell any stock, and does not take account of your objectives, or your financial situation. We aim to bring you long-term focused analysis driven by fundamental data. Note that our analysis may not factor in the latest price-sensitive company announcements or qualitative material. Simply Wall St has no position in any stocks mentioned.
