Is It Too Late To Consider Constellium (CSTM) After A 110% One Year Rally
Constellium SE Class A CSTM | 0.00 |
- If you are wondering whether Constellium's current share price still offers value, you are not alone. Many investors are asking the same question after its recent run.
- The stock last closed at US$22.77, with returns of 13.9% over 7 days, 23.9% over 30 days, 15.2% year to date and 109.9% over 1 year. This naturally raises questions about what is already priced in.
- Recent attention on Constellium has centered on its position as an aluminum products supplier across automotive, packaging and aerospace markets. This keeps it closely watched whenever sector news hits. Sector wide discussions around demand for lightweight materials and packaging have helped put a spotlight on companies like Constellium and may provide context for the stock's recent moves.
- Constellium currently records a valuation score of 3 out of 6, which reflects how it screens on several traditional checks and sets up a closer look at different valuation methods, with an even more practical way to think about value coming at the end of this article.
Approach 1: Constellium Discounted Cash Flow (DCF) Analysis
A Discounted Cash Flow, or DCF, model takes estimates of the cash a business could generate in the future and discounts those amounts back to today, aiming to arrive at an implied value for the equity.
For Constellium, the model used here is a 2 Stage Free Cash Flow to Equity approach. The company most recently reported free cash flow of a loss of $49.65 million, so the story in this model rests on projected improvements in future cash flows rather than current levels.
Analysts provide explicit free cash flow estimates out to 2027, with Simply Wall St extending the projections to 2035. Those projections reach $689.56 million in 2035, with each year’s cash flow discounted back to today in dollar terms and summed to get an equity value per share.
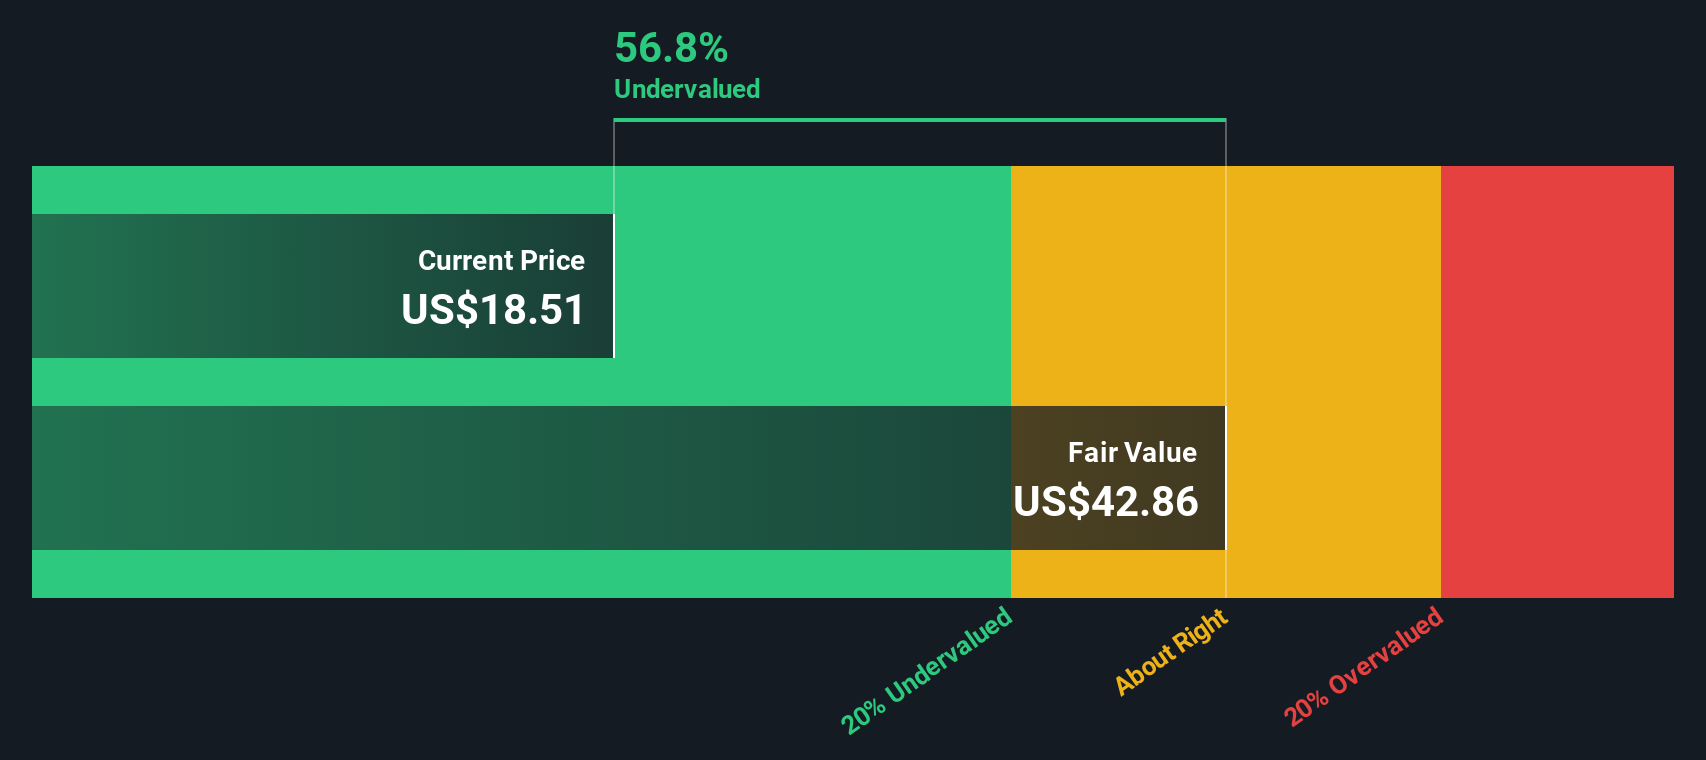
This process produces an estimated intrinsic value of about $45.27 per share, compared with the recent share price of $22.77. That gap equates to an implied discount of roughly 49.7%, indicating that Constellium appears materially undervalued on this DCF model.
Result: UNDERVALUED
Our Discounted Cash Flow (DCF) analysis suggests Constellium is undervalued by 49.7%. Track this in your watchlist or portfolio, or discover 884 more undervalued stocks based on cash flows.
Approach 2: Constellium Price vs Earnings
For profitable companies, the P/E ratio is a useful way to think about value because it directly links what you pay for each share with the earnings the business is currently generating. Investors usually accept a higher P/E when they expect stronger growth or see lower risk, and look for a lower P/E when growth expectations are modest or risks feel higher.
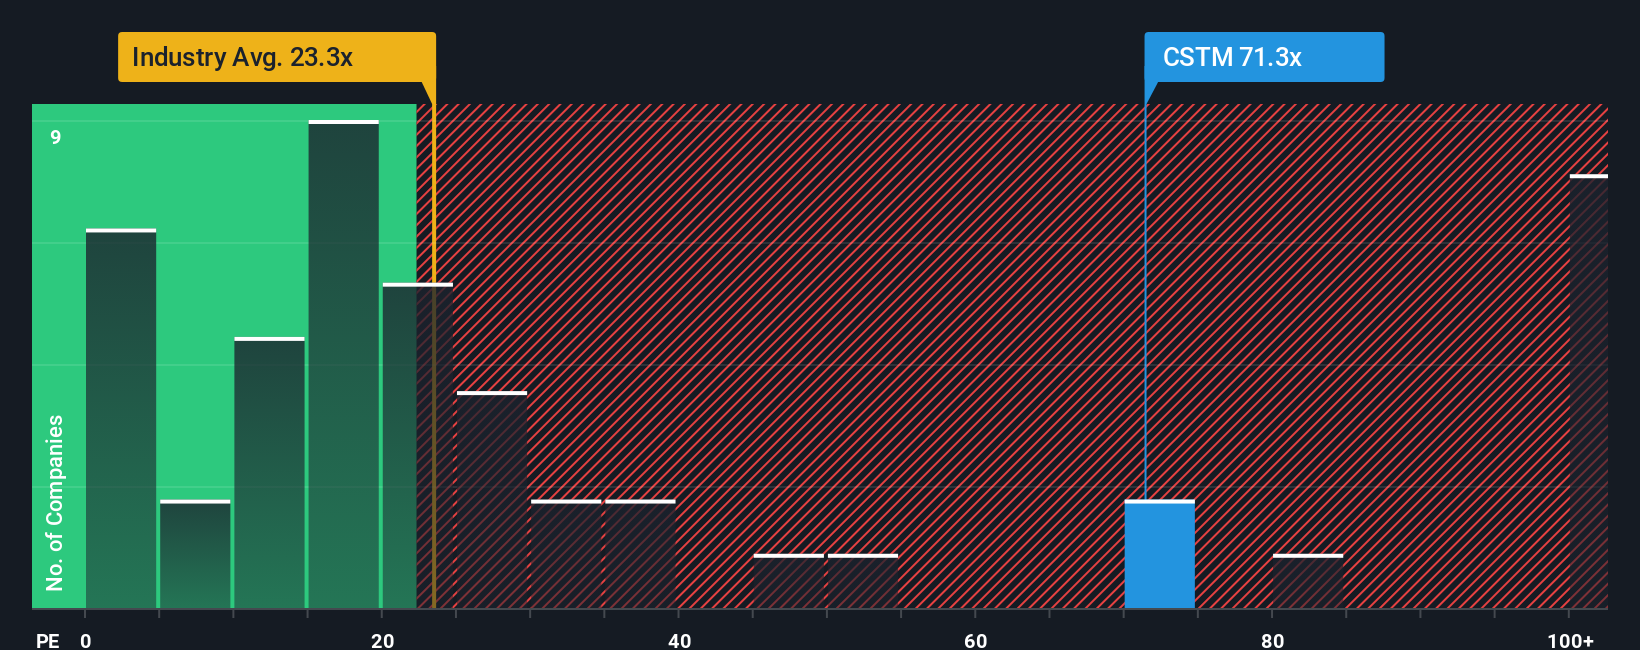
Constellium currently trades on a P/E of 27.8x. That sits close to the Metals and Mining industry average P/E of 26.8x, and below the broader peer group average of 53.1x. On the surface, that suggests the market is pricing Constellium roughly in line with its sector, and at a discount to some peers.
Simply Wall St also calculates a Fair Ratio, which is a proprietary P/E estimate that reflects factors such as earnings growth, industry, profit margin, market cap and company specific risks. For Constellium, the Fair Ratio is 23.1x. This is more tailored than a simple comparison with peers or the industry, because it adjusts for the company’s own characteristics rather than assuming it should trade like an average stock. With the current P/E of 27.8x sitting above the Fair Ratio of 23.1x, Constellium screens as somewhat expensive on this metric.
Result: OVERVALUED
P/E ratios tell one story, but what if the real opportunity lies elsewhere? Discover 1440 companies where insiders are betting big on explosive growth.
Upgrade Your Decision Making: Choose your Constellium Narrative
Earlier we mentioned that there is an even better way to understand valuation, so let us introduce you to Narratives. Narratives let you put a clear story behind your numbers by linking your view on Constellium’s future revenue, earnings and margins to a financial forecast and then to a fair value estimate that you can compare with today’s price. All of this happens inside the Simply Wall St Community page, where Narratives are updated automatically when new information such as earnings or news arrives. For example, one investor might build a Narrative around the US$20.12 analyst fair value with assumptions similar to the consensus. Another might set a much lower or higher fair value based on a more cautious or optimistic view about factors like buybacks, leadership change and demand in its end markets. This gives you a clear, easy-to-use framework for deciding whether the current market price looks high or low against the story you believe.
Do you think there's more to the story for Constellium? Head over to our Community to see what others are saying!

This article by Simply Wall St is general in nature. We provide commentary based on historical data and analyst forecasts only using an unbiased methodology and our articles are not intended to be financial advice. It does not constitute a recommendation to buy or sell any stock, and does not take account of your objectives, or your financial situation. We aim to bring you long-term focused analysis driven by fundamental data. Note that our analysis may not factor in the latest price-sensitive company announcements or qualitative material. Simply Wall St has no position in any stocks mentioned.